|
Download Data (XLS File) |
|
||||||||
|
||||||||
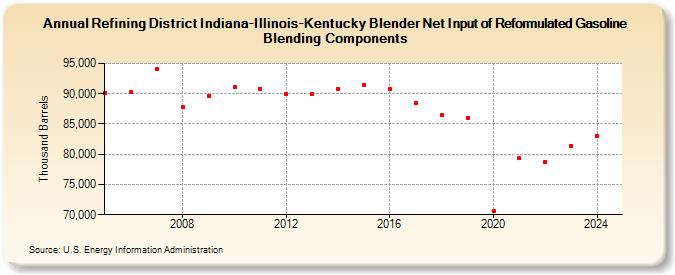
| Refining District Indiana-Illinois-Kentucky Blender Net Input of Reformulated Gasoline Blending Components (Thousand Barrels) | ||||||||
| Decade | Year-0 | Year-1 | Year-2 | Year-3 | Year-4 | Year-5 | Year-6 | Year-7 | Year-8 | Year-9 |
|---|---|---|---|---|---|---|---|---|---|---|
| 2000's | 90,058 | 90,213 | 94,028 | 87,786 | 89,706 | |||||
| 2010's | 91,048 | 90,853 | 89,980 | 89,948 | 90,801 | 91,523 | 90,750 | 88,444 | 86,452 | 86,034 |
| 2020's | 70,649 | 79,368 | 78,703 | 81,350 |
| - = No Data Reported; -- = Not Applicable; NA = Not Available; W = Withheld to avoid disclosure of individual company data. |
| Release Date: 8/30/2024 |
| Next Release Date: 8/29/2025 |