|
Download Data (XLS File) |
|
||||||||
|
||||||||
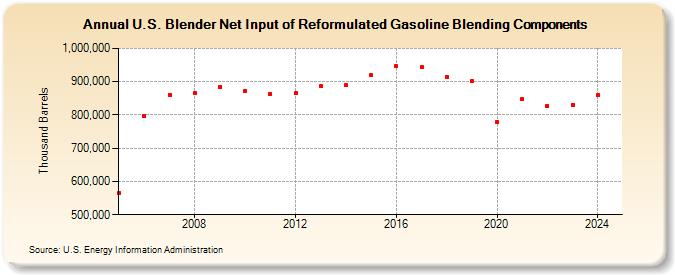
| U.S. Blender Net Input of Reformulated Gasoline Blending Components (Thousand Barrels) | ||||||||
| Decade | Year-0 | Year-1 | Year-2 | Year-3 | Year-4 | Year-5 | Year-6 | Year-7 | Year-8 | Year-9 |
|---|---|---|---|---|---|---|---|---|---|---|
| 2000's | 565,731 | 797,350 | 860,289 | 865,498 | 884,827 | |||||
| 2010's | 872,987 | 862,882 | 865,203 | 885,664 | 888,634 | 919,361 | 946,037 | 943,073 | 914,384 | 902,225 |
| 2020's | 779,748 | 846,490 | 828,310 | 830,752 |
| - = No Data Reported; -- = Not Applicable; NA = Not Available; W = Withheld to avoid disclosure of individual company data. |
| Release Date: 3/29/2024 |
| Next Release Date: 8/30/2024 |