|
Download Data (XLS File) |
|
||||||||
|
||||||||
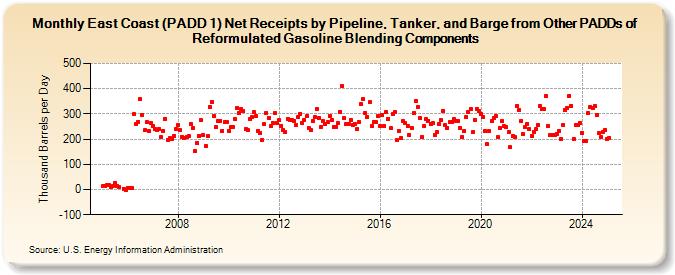
| East Coast (PADD 1) Net Receipts by Pipeline, Tanker, and Barge from Other PADDs of Reformulated Gasoline Blending Components (Thousand Barrels per Day) | ||||||||
| Year | Jan | Feb | Mar | Apr | May | Jun | Jul | Aug | Sep | Oct | Nov | Dec |
|---|---|---|---|---|---|---|---|---|---|---|---|---|
| 2005 | 12 | 13 | 16 | 16 | 8 | 15 | 27 | 14 | 8 | 4 | -1 | |
| 2006 | 7 | 5 | 5 | 298 | 259 | 269 | 359 | 297 | 235 | 267 | 233 | 263 |
| 2007 | 251 | 241 | 237 | 239 | 208 | 233 | 281 | 197 | 203 | 201 | 214 | 242 |
| 2008 | 256 | 235 | 210 | 204 | 207 | 212 | 260 | 245 | 152 | 185 | 213 | 274 |
| 2009 | 216 | 173 | 212 | 328 | 347 | 292 | 247 | 273 | 272 | 233 | 268 | 268 |
| 2010 | 234 | 247 | 248 | 279 | 325 | 304 | 321 | 311 | 240 | 236 | 279 | 286 |
| 2011 | 306 | 291 | 234 | 223 | 198 | 259 | 304 | 283 | 250 | 264 | 302 | 265 |
| 2012 | 275 | 253 | 236 | 228 | 280 | 276 | 274 | 273 | 256 | 288 | 300 | 264 |
| 2013 | 274 | 290 | 245 | 236 | 272 | 286 | 320 | 283 | 248 | 270 | 259 | 268 |
| 2014 | 292 | 274 | 248 | 249 | 262 | 309 | 411 | 283 | 260 | 258 | 276 | 256 |
| 2015 | 261 | 239 | 268 | 339 | 360 | 304 | 289 | 346 | 251 | 269 | 266 | 290 |
| 2016 | 252 | 295 | 251 | 307 | 281 | 243 | 300 | 307 | 196 | 234 | 205 | 270 |
| 2017 | 262 | 250 | 217 | 244 | 304 | 353 | 328 | 283 | 209 | 252 | 278 | 273 |
| 2018 | 258 | 262 | 217 | 229 | 261 | 274 | 312 | 254 | 244 | 267 | 268 | 279 |
| 2019 | 272 | 271 | 245 | 208 | 233 | 288 | 309 | 320 | 227 | 277 | 320 | 313 |
| 2020 | 299 | 289 | 231 | 180 | 232 | 271 | 283 | 292 | 207 | 245 | 270 | 252 |
| 2021 | 248 | 227 | 167 | 213 | 209 | 330 | 316 | 272 | 219 | 248 | 261 | 239 |
| 2022 | 214 | 230 | 239 | 256 | 331 | 321 | 318 | 371 | 252 | 215 | 217 | 216 |
| 2023 | 222 | 233 | 201 | 256 | 315 | 324 | 372 | 333 | 202 | 255 | 254 | 264 |
| 2024 | 225 | |||||||||||
| - = No Data Reported; -- = Not Applicable; NA = Not Available; W = Withheld to avoid disclosure of individual company data. |
| Release Date: 3/29/2024 |
| Next Release Date: 4/30/2024 |