|
Download Data (XLS File) |
|
||||||||
|
||||||||
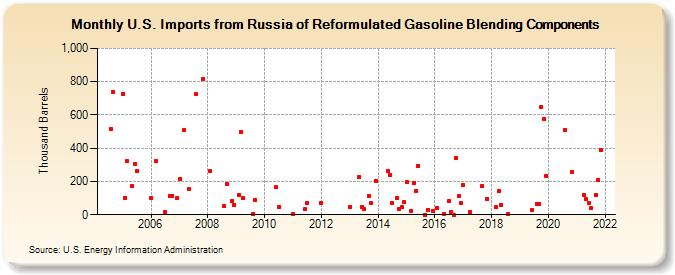
| U.S. Imports from Russia of Reformulated Gasoline Blending Components (Thousand Barrels) | ||||||||
| Year | Jan | Feb | Mar | Apr | May | Jun | Jul | Aug | Sep | Oct | Nov | Dec |
|---|---|---|---|---|---|---|---|---|---|---|---|---|
| 2004 | 518 | 740 | ||||||||||
| 2005 | 725 | 100 | 322 | 174 | 305 | 263 | ||||||
| 2006 | 102 | 324 | 16 | 113 | 115 | 101 | ||||||
| 2007 | 214 | 512 | 152 | 723 | 815 | |||||||
| 2008 | 264 | 52 | 185 | 80 | 56 | |||||||
| 2009 | 120 | 500 | 100 | 3 | 87 | |||||||
| 2010 | 165 | 47 | ||||||||||
| 2011 | 3 | 32 | 70 | |||||||||
| 2012 | 69 | |||||||||||
| 2013 | 48 | 229 | 45 | 32 | 115 | 68 | 204 | |||||
| 2014 | 261 | 239 | 71 | 103 | 36 | 44 | 76 | |||||
| 2015 | 195 | 22 | 193 | 145 | 295 | 1 | 31 | 22 | ||||
| 2016 | 43 | 6 | 83 | 19 | 1 | 341 | 112 | 70 | ||||
| 2017 | 179 | 16 | 173 | 96 | ||||||||
| 2018 | 45 | 140 | 60 | 3 | ||||||||
| 2019 | 31 | 67 | 64 | 650 | 577 | 233 | ||||||
| 2020 | 507 | 258 | ||||||||||
| 2021 | 116 | 92 | 68 | 38 | 120 | 210 | 391 | |||||
| - = No Data Reported; -- = Not Applicable; NA = Not Available; W = Withheld to avoid disclosure of individual company data. |
| Release Date: 6/28/2024 |
| Next Release Date: 7/31/2024 |