|
Download Data (XLS File) |
|
||||||||
|
||||||||
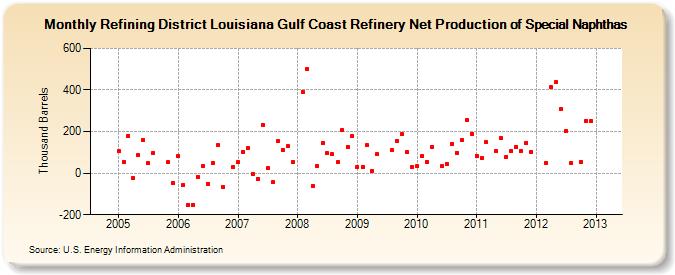
| Refining District Louisiana Gulf Coast Refinery Net Production of Special Naphthas (Thousand Barrels) | ||||||||
| Year | Jan | Feb | Mar | Apr | May | Jun | Jul | Aug | Sep | Oct | Nov | Dec |
|---|---|---|---|---|---|---|---|---|---|---|---|---|
| 2005 | 105 | 53 | 180 | -24 | 85 | 159 | 47 | 99 | 53 | -48 | ||
| 2006 | 83 | -56 | -152 | -151 | -18 | 33 | -50 | 51 | 133 | -65 | 30 | |
| 2007 | 52 | 103 | 122 | -2 | -28 | 232 | 23 | -45 | 153 | 112 | 129 | 52 |
| 2008 | 391 | 500 | -61 | 32 | 147 | 95 | 90 | 52 | 207 | 128 | 177 | |
| 2009 | 29 | 29 | 133 | 11 | 90 | 110 | 156 | 187 | 101 | 29 | ||
| 2010 | 32 | 83 | 54 | 127 | 34 | 45 | 142 | 99 | 160 | 256 | 189 | |
| 2011 | 84 | 73 | 148 | 105 | 167 | 80 | 106 | 127 | 106 | 147 | 104 | |
| 2012 | 51 | 414 | 438 | 307 | 205 | 50 | 54 | 252 | 251 | |||
| - = No Data Reported; -- = Not Applicable; NA = Not Available; W = Withheld to avoid disclosure of individual company data. |
| Release Date: 3/29/2024 |
| Next Release Date: 4/30/2024 |