|
Download Data (XLS File) |
|
||||||||
|
||||||||
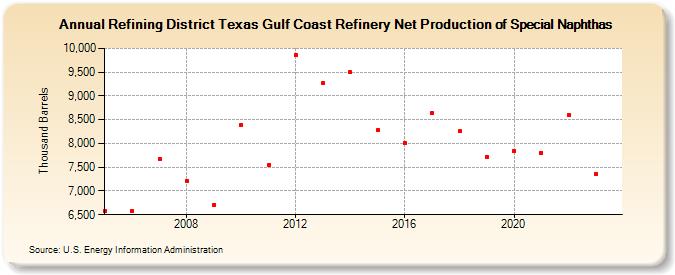
| Refining District Texas Gulf Coast Refinery Net Production of Special Naphthas (Thousand Barrels) | ||||||||
| Decade | Year-0 | Year-1 | Year-2 | Year-3 | Year-4 | Year-5 | Year-6 | Year-7 | Year-8 | Year-9 |
|---|---|---|---|---|---|---|---|---|---|---|
| 2000's | 6,587 | 6,585 | 7,676 | 7,217 | 6,705 | |||||
| 2010's | 8,391 | 7,543 | 9,857 | 9,282 | 9,496 | 8,281 | 8,019 | 8,638 | 8,252 | 7,724 |
| 2020's | 7,841 | 7,807 | 8,594 | 7,356 |
| - = No Data Reported; -- = Not Applicable; NA = Not Available; W = Withheld to avoid disclosure of individual company data. |
| Release Date: 3/29/2024 |
| Next Release Date: 8/30/2024 |