|
Download Data (XLS File) |
|
||||||||
|
||||||||
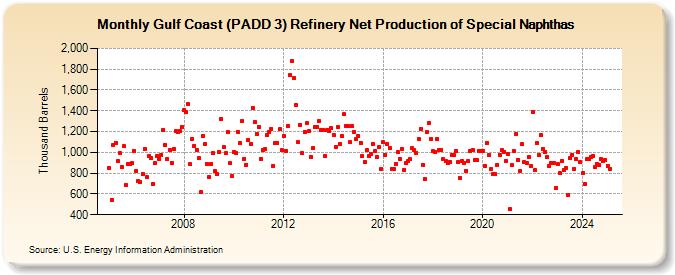
| Gulf Coast (PADD 3) Refinery Net Production of Special Naphthas (Thousand Barrels) | ||||||||
| Year | Jan | Feb | Mar | Apr | May | Jun | Jul | Aug | Sep | Oct | Nov | Dec |
|---|---|---|---|---|---|---|---|---|---|---|---|---|
| 2005 | 851 | 546 | 1,075 | 1,094 | 915 | 994 | 859 | 1,057 | 684 | 885 | 886 | 895 |
| 2006 | 1,014 | 822 | 722 | 719 | 792 | 1,034 | 759 | 961 | 945 | 700 | 894 | 964 |
| 2007 | 939 | 977 | 1,219 | 1,072 | 935 | 1,021 | 900 | 1,034 | 1,201 | 1,199 | 1,209 | 1,248 |
| 2008 | 1,406 | 1,386 | 1,463 | 885 | 1,130 | 1,065 | 1,026 | 945 | 616 | 1,155 | 1,077 | 888 |
| 2009 | 761 | 891 | 989 | 817 | 788 | 1,003 | 1,322 | 1,053 | 991 | 1,192 | 893 | 771 |
| 2010 | 1,005 | 989 | 1,200 | 1,087 | 1,302 | 940 | 882 | 1,119 | 1,076 | 1,431 | 1,291 | 1,180 |
| 2011 | 1,244 | 939 | 1,021 | 1,028 | 1,164 | 1,198 | 1,228 | 871 | 1,087 | 1,093 | 1,221 | 1,021 |
| 2012 | 1,162 | 1,016 | 1,256 | 1,743 | 1,875 | 1,718 | 1,455 | 1,095 | 1,266 | 991 | 1,198 | 1,278 |
| 2013 | 1,205 | 960 | 1,039 | 1,248 | 1,243 | 1,299 | 1,219 | 1,213 | 964 | 1,219 | 1,210 | 1,230 |
| 2014 | 1,168 | 1,056 | 1,243 | 1,079 | 1,159 | 1,366 | 1,258 | 1,250 | 1,097 | 1,252 | 1,200 | 1,125 |
| 2015 | 1,162 | 1,094 | 965 | 910 | 1,020 | 963 | 987 | 1,084 | 1,012 | 955 | 1,049 | 836 |
| 2016 | 1,097 | 979 | 1,082 | 1,045 | 842 | 842 | 892 | 1,000 | 940 | 1,033 | 830 | 902 |
| 2017 | 918 | 932 | 1,037 | 1,019 | 998 | 1,129 | 1,228 | 880 | 744 | 1,195 | 1,285 | 1,130 |
| 2018 | 1,012 | 1,003 | 1,126 | 1,023 | 1,024 | 933 | 912 | 898 | 910 | 974 | 973 | 1,009 |
| 2019 | 909 | 757 | 916 | 899 | 824 | 914 | 1,009 | 1,021 | 922 | 924 | 1,017 | 1,012 |
| 2020 | 1,011 | 871 | 1,092 | 976 | 840 | 787 | 790 | 877 | 979 | 1,020 | 1,006 | 921 |
| 2021 | 988 | 451 | 875 | 1,012 | 1,180 | 931 | 824 | 1,076 | 906 | 899 | 952 | 871 |
| 2022 | 1,386 | 827 | 1,091 | 970 | 1,165 | 1,031 | 1,008 | 955 | 873 | 901 | 897 | 656 |
| 2023 | 885 | 803 | 921 | 828 | 847 | 589 | 941 | 977 | 839 | 939 | 999 | 906 |
| 2024 | 798 | 699 | 933 | 932 | ||||||||
| - = No Data Reported; -- = Not Applicable; NA = Not Available; W = Withheld to avoid disclosure of individual company data. |
| Release Date: 6/28/2024 |
| Next Release Date: 7/31/2024 |