|
Download Data (XLS File) |
|
||||||||
|
||||||||
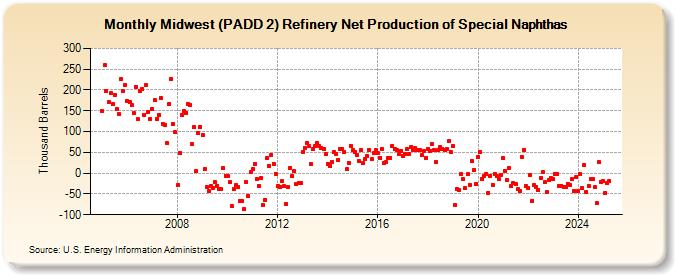
| Midwest (PADD 2) Refinery Net Production of Special Naphthas (Thousand Barrels) | ||||||||
| Year | Jan | Feb | Mar | Apr | May | Jun | Jul | Aug | Sep | Oct | Nov | Dec |
|---|---|---|---|---|---|---|---|---|---|---|---|---|
| 2005 | 149 | 260 | 197 | 170 | 192 | 166 | 189 | 154 | 142 | 226 | 198 | 213 |
| 2006 | 173 | 171 | 163 | 144 | 208 | 129 | 197 | 203 | 140 | 211 | 148 | 130 |
| 2007 | 154 | 175 | 129 | 140 | 181 | 119 | 116 | 72 | 167 | 226 | 118 | 98 |
| 2008 | -29 | 48 | 140 | 149 | 145 | 166 | 164 | 69 | 110 | 4 | 96 | 111 |
| 2009 | 91 | 10 | -33 | -43 | -31 | -35 | -22 | -30 | -39 | -39 | 12 | -6 |
| 2010 | -8 | -22 | -79 | -39 | -29 | -33 | -66 | -67 | -87 | -21 | -55 | 3 |
| 2011 | 9 | 23 | -15 | -31 | -11 | -76 | -64 | 36 | 17 | 44 | 23 | -1 |
| 2012 | -31 | -34 | -20 | -32 | -74 | -34 | 13 | -8 | 4 | -27 | -23 | -23 |
| 2013 | 52 | 60 | 72 | 66 | 21 | 57 | 66 | 73 | 65 | 61 | 59 | 45 |
| 2014 | 23 | 17 | 27 | 50 | 46 | 32 | 58 | 58 | 51 | 9 | 25 | 66 |
| 2015 | 55 | 51 | 43 | 28 | 55 | 24 | 34 | 41 | 55 | 33 | 48 | 55 |
| 2016 | 48 | 37 | 59 | 25 | 27 | 37 | 37 | 65 | 58 | 55 | 46 | 54 |
| 2017 | 42 | 46 | 58 | 45 | 63 | 55 | 61 | 55 | 55 | 43 | 53 | 37 |
| 2018 | 57 | 53 | 70 | 55 | 27 | 56 | 63 | 59 | 55 | 59 | 77 | 50 |
| 2019 | 65 | -77 | -39 | -41 | -3 | -15 | -36 | -3 | -28 | 30 | 7 | -26 |
| 2020 | 39 | 50 | -14 | -6 | -2 | -47 | -6 | -28 | -1 | -8 | -15 | -4 |
| 2021 | 36 | 4 | -17 | 12 | -32 | -24 | -27 | -39 | -44 | 40 | 56 | -32 |
| 2022 | -36 | -4 | -66 | -29 | -33 | -40 | -12 | 2 | -22 | -46 | -16 | -12 |
| 2023 | -15 | -1 | -3 | -30 | -30 | -33 | -33 | -25 | -28 | -14 | -43 | -9 |
| 2024 | -44 | |||||||||||
| - = No Data Reported; -- = Not Applicable; NA = Not Available; W = Withheld to avoid disclosure of individual company data. |
| Release Date: 3/29/2024 |
| Next Release Date: 4/30/2024 |