|
Download Data (XLS File) |
|
||||||||
|
||||||||
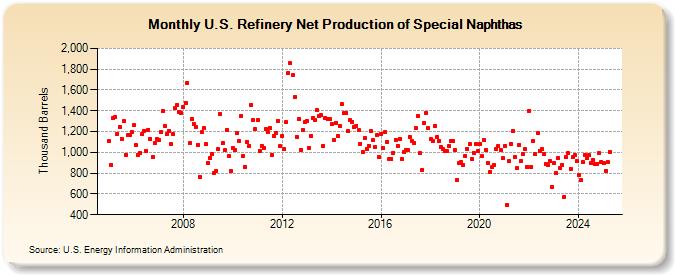
| U.S. Refinery Net Production of Special Naphthas (Thousand Barrels) | ||||||||
| Year | Jan | Feb | Mar | Apr | May | Jun | Jul | Aug | Sep | Oct | Nov | Dec |
|---|---|---|---|---|---|---|---|---|---|---|---|---|
| 2005 | 1,107 | 880 | 1,329 | 1,340 | 1,181 | 1,248 | 1,129 | 1,297 | 977 | 1,163 | 1,166 | 1,192 |
| 2006 | 1,259 | 1,066 | 979 | 996 | 1,177 | 1,210 | 1,017 | 1,219 | 1,130 | 955 | 1,092 | 1,130 |
| 2007 | 1,118 | 1,196 | 1,400 | 1,250 | 1,172 | 1,203 | 1,076 | 1,173 | 1,422 | 1,460 | 1,388 | 1,378 |
| 2008 | 1,438 | 1,478 | 1,671 | 1,089 | 1,320 | 1,277 | 1,245 | 1,074 | 766 | 1,193 | 1,231 | 1,078 |
| 2009 | 896 | 949 | 986 | 804 | 821 | 1,029 | 1,370 | 1,087 | 1,019 | 1,214 | 963 | 821 |
| 2010 | 1,040 | 1,018 | 1,182 | 1,110 | 1,345 | 965 | 860 | 1,104 | 1,062 | 1,458 | 1,309 | 1,223 |
| 2011 | 1,313 | 1,016 | 1,059 | 1,046 | 1,226 | 1,192 | 1,232 | 973 | 1,160 | 1,189 | 1,305 | 1,057 |
| 2012 | 1,162 | 1,029 | 1,288 | 1,762 | 1,856 | 1,740 | 1,530 | 1,148 | 1,321 | 1,027 | 1,219 | 1,288 |
| 2013 | 1,301 | 1,043 | 1,161 | 1,335 | 1,314 | 1,403 | 1,348 | 1,356 | 1,064 | 1,332 | 1,321 | 1,318 |
| 2014 | 1,270 | 1,123 | 1,285 | 1,158 | 1,251 | 1,461 | 1,375 | 1,376 | 1,207 | 1,307 | 1,296 | 1,248 |
| 2015 | 1,256 | 1,216 | 1,083 | 999 | 1,137 | 1,030 | 1,064 | 1,204 | 1,116 | 1,052 | 1,164 | 955 |
| 2016 | 1,178 | 1,040 | 1,193 | 1,104 | 938 | 934 | 998 | 1,122 | 1,065 | 1,127 | 935 | 1,006 |
| 2017 | 1,020 | 1,018 | 1,151 | 1,109 | 1,090 | 1,230 | 1,353 | 989 | 834 | 1,285 | 1,378 | 1,231 |
| 2018 | 1,124 | 1,106 | 1,251 | 1,144 | 1,112 | 1,048 | 1,030 | 1,014 | 1,014 | 1,057 | 1,110 | 1,111 |
| 2019 | 1,022 | 734 | 895 | 905 | 880 | 967 | 1,035 | 1,076 | 935 | 997 | 1,078 | 1,009 |
| 2020 | 1,078 | 962 | 1,122 | 1,021 | 896 | 809 | 855 | 878 | 1,031 | 1,060 | 1,027 | 944 |
| 2021 | 1,063 | 497 | 914 | 1,085 | 1,209 | 957 | 847 | 1,075 | 919 | 987 | 1,029 | 862 |
| 2022 | 1,399 | 859 | 1,111 | 982 | 1,185 | 1,016 | 1,032 | 985 | 886 | 876 | 915 | 669 |
| 2023 | 898 | 799 | 949 | 845 | 879 | 574 | 955 | 990 | 843 | 955 | 972 | 915 |
| 2024 | 781 | |||||||||||
| - = No Data Reported; -- = Not Applicable; NA = Not Available; W = Withheld to avoid disclosure of individual company data. |
| Release Date: 3/29/2024 |
| Next Release Date: 4/30/2024 |
Referring Pages: