|
Download Data (XLS File) |
|
||||||||
|
||||||||
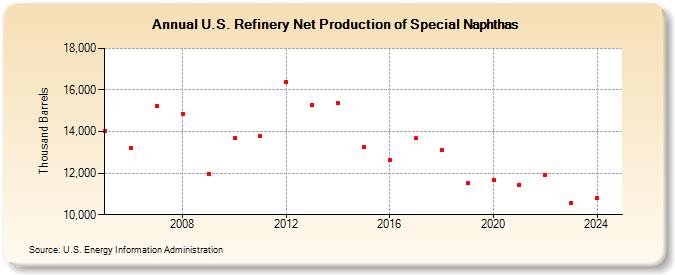
| U.S. Refinery Net Production of Special Naphthas (Thousand Barrels) | ||||||||
| Decade | Year-0 | Year-1 | Year-2 | Year-3 | Year-4 | Year-5 | Year-6 | Year-7 | Year-8 | Year-9 |
|---|---|---|---|---|---|---|---|---|---|---|
| 2000's | 14,009 | 13,230 | 15,236 | 14,860 | 11,959 | |||||
| 2010's | 13,676 | 13,768 | 16,370 | 15,296 | 15,357 | 13,276 | 12,640 | 13,688 | 13,121 | 11,533 |
| 2020's | 11,683 | 11,444 | 11,915 | 10,574 |
| - = No Data Reported; -- = Not Applicable; NA = Not Available; W = Withheld to avoid disclosure of individual company data. |
| Release Date: 3/29/2024 |
| Next Release Date: 8/30/2024 |
Referring Pages: