|
Download Data (XLS File) |
|
||||||||
|
||||||||
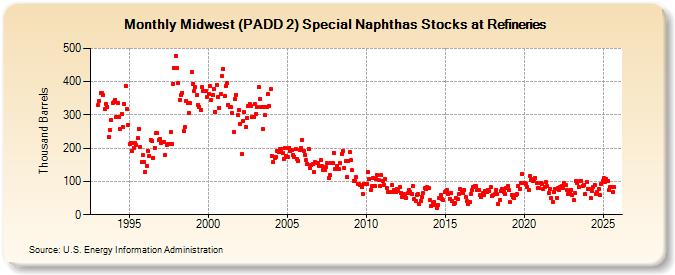
| Midwest (PADD 2) Special Naphthas Stocks at Refineries (Thousand Barrels) | ||||||||
| Year | Jan | Feb | Mar | Apr | May | Jun | Jul | Aug | Sep | Oct | Nov | Dec |
|---|---|---|---|---|---|---|---|---|---|---|---|---|
| 1993 | 329 | 343 | 367 | 365 | 359 | 318 | 334 | 325 | 233 | 255 | 285 | 335 |
| 1994 | 338 | 346 | 295 | 335 | 293 | 259 | 303 | 264 | 333 | 387 | 318 | 270 |
| 1995 | 212 | 215 | 191 | 202 | 216 | 209 | 230 | 259 | 203 | 158 | 181 | 159 |
| 1996 | 129 | 147 | 193 | 177 | 224 | 223 | 171 | 200 | 245 | 245 | 226 | 228 |
| 1997 | 217 | 219 | 219 | 181 | 209 | 213 | 213 | 248 | 213 | 394 | 440 | 478 |
| 1998 | 440 | 395 | 346 | 360 | 367 | 251 | 263 | 342 | 335 | 307 | 335 | 429 |
| 1999 | 394 | 373 | 383 | 359 | 330 | 325 | 316 | 383 | 373 | 371 | 372 | 355 |
| 2000 | 363 | 386 | 345 | 361 | 378 | 310 | 391 | 353 | 322 | 363 | 416 | 438 |
| 2001 | 356 | 387 | 395 | 331 | 323 | 323 | 305 | 249 | 347 | 361 | 299 | 315 |
| 2002 | 273 | 182 | 281 | 308 | 265 | 290 | 326 | 333 | 327 | 293 | 294 | 332 |
| 2003 | 304 | 323 | 384 | 349 | 324 | 259 | 324 | 299 | 325 | 362 | 327 | 377 |
| 2004 | 178 | 157 | 171 | 174 | 191 | 189 | 197 | 199 | 186 | 167 | 202 | 178 |
| 2005 | 174 | 201 | 191 | 194 | 180 | 175 | 197 | 166 | 161 | 194 | 201 | 225 |
| 2006 | 192 | 180 | 164 | 153 | 198 | 140 | 148 | 152 | 128 | 157 | 156 | 156 |
| 2007 | 145 | 165 | 145 | 134 | 135 | 143 | 156 | 111 | 120 | 156 | 156 | 187 |
| 2008 | 137 | 147 | 137 | 138 | 155 | 184 | 193 | 140 | 160 | 113 | 160 | 189 |
| 2009 | 163 | 133 | 102 | 102 | 112 | 92 | 91 | 89 | 83 | 63 | 93 | 92 |
| 2010 | 93 | 127 | 106 | 74 | 85 | 111 | 87 | 108 | 118 | 103 | 85 | 118 |
| 2011 | 102 | 90 | 107 | 80 | 69 | 67 | 67 | 89 | 67 | 74 | 69 | 77 |
| 2012 | 72 | 82 | 64 | 54 | 62 | 59 | 51 | 65 | 75 | 69 | 62 | 87 |
| 2013 | 47 | 41 | 60 | 61 | 31 | 42 | 54 | 65 | 79 | 76 | 82 | 79 |
| 2014 | 43 | 26 | 34 | 37 | 30 | 20 | 29 | 51 | 60 | 48 | 44 | 67 |
| 2015 | 71 | 74 | 63 | 48 | 64 | 42 | 31 | 35 | 50 | 46 | 63 | 76 |
| 2016 | 72 | 65 | 75 | 54 | 40 | 32 | 39 | 62 | 74 | 82 | 85 | 85 |
| 2017 | 73 | 75 | 58 | 52 | 64 | 59 | 70 | 67 | 75 | 71 | 83 | 57 |
| 2018 | 58 | 61 | 75 | 63 | 31 | 45 | 71 | 78 | 68 | 63 | 79 | 87 |
| 2019 | 75 | 37 | 59 | 53 | 49 | 60 | 61 | 85 | 77 | 95 | 121 | 94 |
| 2020 | 95 | 92 | 83 | 74 | 117 | 104 | 102 | 107 | 111 | 94 | 81 | 81 |
| 2021 | 96 | 91 | 78 | 83 | 97 | 85 | 65 | 77 | 50 | 39 | 67 | 77 |
| 2022 | 51 | 79 | 75 | 84 | 87 | 81 | 94 | 88 | 74 | 61 | 69 | 75 |
| 2023 | 60 | 45 | 66 | 101 | 95 | 84 | 100 | 102 | 87 | 89 | 62 | 98 |
| 2024 | 78 | |||||||||||
| - = No Data Reported; -- = Not Applicable; NA = Not Available; W = Withheld to avoid disclosure of individual company data. |
| Release Date: 3/29/2024 |
| Next Release Date: 4/30/2024 |