|
Download Data (XLS File) |
|
||||||||
|
||||||||
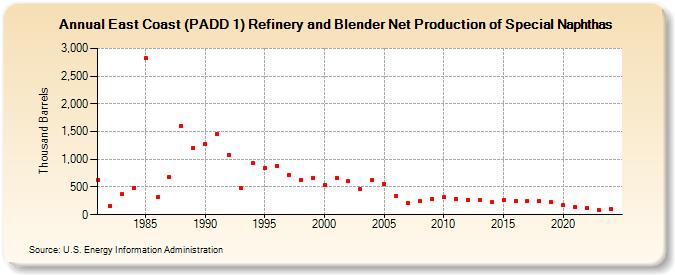
| East Coast (PADD 1) Refinery and Blender Net Production of Special Naphthas (Thousand Barrels) | ||||||||
| Decade | Year-0 | Year-1 | Year-2 | Year-3 | Year-4 | Year-5 | Year-6 | Year-7 | Year-8 | Year-9 |
|---|---|---|---|---|---|---|---|---|---|---|
| 1980's | 629 | 166 | 366 | 481 | 2,831 | 316 | 676 | 1,604 | 1,207 | |
| 1990's | 1,276 | 1,450 | 1,084 | 485 | 937 | 848 | 877 | 715 | 626 | 668 |
| 2000's | 532 | 668 | 600 | 463 | 622 | 545 | 329 | 206 | 245 | 291 |
| 2010's | 313 | 284 | 273 | 264 | 230 | 259 | 256 | 250 | 245 | 228 |
| 2020's | 167 | 148 | 118 | 84 |
| - = No Data Reported; -- = Not Applicable; NA = Not Available; W = Withheld to avoid disclosure of individual company data. |
| Release Date: 3/29/2024 |
| Next Release Date: 8/30/2024 |