|
Download Data (XLS File) |
|
||||||||
|
||||||||
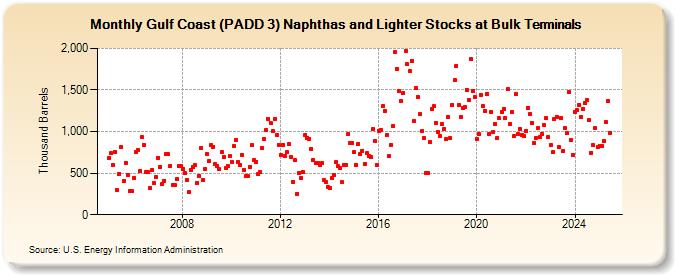
| Gulf Coast (PADD 3) Naphthas and Lighter Stocks at Bulk Terminals (Thousand Barrels) | ||||||||
| Year | Jan | Feb | Mar | Apr | May | Jun | Jul | Aug | Sep | Oct | Nov | Dec |
|---|---|---|---|---|---|---|---|---|---|---|---|---|
| 2005 | 684 | 739 | 592 | 759 | 294 | 495 | 810 | 400 | 625 | 479 | 284 | 283 |
| 2006 | 446 | 752 | 781 | 521 | 934 | 844 | 512 | 515 | 316 | 537 | 379 | 453 |
| 2007 | 685 | 576 | 374 | 409 | 729 | 728 | 588 | 360 | 356 | 427 | 580 | 588 |
| 2008 | 549 | 502 | 418 | 271 | 539 | 574 | 593 | 387 | 470 | 804 | 420 | 552 |
| 2009 | 728 | 646 | 836 | 820 | 606 | 588 | 544 | 750 | 692 | 558 | 586 | 704 |
| 2010 | 634 | 827 | 897 | 639 | 601 | 719 | 535 | 466 | 463 | 579 | 840 | 657 |
| 2011 | 637 | 493 | 508 | 801 | 905 | 1,015 | 1,154 | 1,106 | 1,006 | 1,148 | 962 | 842 |
| 2012 | 714 | 842 | 711 | 752 | 845 | 698 | 391 | 652 | 255 | 503 | 439 | 510 |
| 2013 | 954 | 927 | 916 | 791 | 655 | 618 | 620 | 602 | 618 | 417 | 398 | 338 |
| 2014 | 317 | 441 | 483 | 629 | 582 | 566 | 389 | 598 | 601 | 965 | 865 | 862 |
| 2015 | 751 | 598 | 853 | 734 | 771 | 611 | 737 | 707 | 693 | 1,032 | 882 | 600 |
| 2016 | 1,012 | 1,018 | 1,306 | 1,246 | 959 | 705 | 844 | 1,069 | 1,952 | 1,755 | 1,488 | 1,362 |
| 2017 | 1,461 | 1,973 | 1,809 | 1,728 | 1,846 | 1,127 | 1,518 | 1,419 | 1,208 | 1,002 | 925 | 503 |
| 2018 | 501 | 872 | 1,271 | 1,304 | 1,107 | 1,000 | 948 | 1,089 | 1,032 | 906 | 1,178 | 923 |
| 2019 | 1,323 | 1,616 | 1,794 | 1,317 | 1,172 | 1,281 | 1,296 | 1,504 | 1,378 | 1,868 | 1,487 | 1,414 |
| 2020 | 907 | 973 | 1,444 | 1,307 | 1,253 | 1,457 | 976 | 1,238 | 992 | 1,088 | 925 | 1,157 |
| 2021 | 1,238 | 1,270 | 1,161 | 1,506 | 1,088 | 1,236 | 943 | 1,454 | 970 | 1,036 | 962 | 946 |
| 2022 | 1,009 | 1,288 | 1,209 | 1,104 | 864 | 924 | 1,045 | 940 | 972 | 1,077 | 1,160 | 932 |
| 2023 | 838 | 750 | 1,145 | 1,159 | 812 | 1,166 | 765 | 1,039 | 978 | 1,478 | 904 | 724 |
| 2024 | 1,230 | 1,254 | 1,319 | 1,179 | ||||||||
| - = No Data Reported; -- = Not Applicable; NA = Not Available; W = Withheld to avoid disclosure of individual company data. |
| Release Date: 6/28/2024 |
| Next Release Date: 7/31/2024 |