|
Download Data (XLS File) |
|
||||||||
|
||||||||
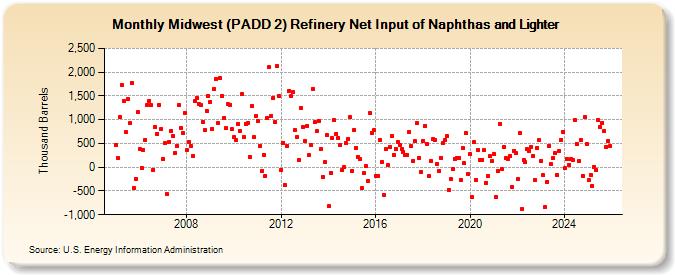
| Midwest (PADD 2) Refinery Net Input of Naphthas and Lighter (Thousand Barrels) | ||||||||
| Year | Jan | Feb | Mar | Apr | May | Jun | Jul | Aug | Sep | Oct | Nov | Dec |
|---|---|---|---|---|---|---|---|---|---|---|---|---|
| 2005 | 477 | 196 | 1,050 | 1,729 | 1,393 | 732 | 1,425 | 926 | 1,781 | -448 | -238 | 1,158 |
| 2006 | 387 | -7 | 364 | 574 | 1,310 | 1,402 | 1,303 | -49 | 844 | 708 | 1,319 | 812 |
| 2007 | 168 | 500 | -565 | 532 | 770 | 663 | 302 | 453 | 1,302 | 831 | 730 | 1,145 |
| 2008 | 363 | 539 | 446 | 237 | 1,386 | 1,454 | 1,330 | 1,306 | 951 | 774 | 1,186 | 1,489 |
| 2009 | 1,382 | 812 | 1,642 | 1,859 | 934 | 1,878 | 1,499 | 1,041 | 819 | 1,320 | 1,318 | 798 |
| 2010 | 627 | 566 | 909 | 763 | 1,535 | 641 | 919 | 940 | 218 | 1,290 | 627 | 1,081 |
| 2011 | 981 | 447 | -81 | 258 | -177 | 1,044 | 2,108 | 1,081 | 1,462 | 960 | 2,123 | 1,489 |
| 2012 | -49 | 517 | -385 | 452 | 1,610 | 1,494 | 1,577 | 774 | 640 | 156 | 1,246 | 853 |
| 2013 | 552 | 871 | 254 | 460 | 1,651 | 950 | 752 | 975 | 380 | -196 | 99 | 674 |
| 2014 | -827 | -115 | 614 | 986 | 704 | 612 | 472 | -60 | 4 | 500 | 601 | 1,047 |
| 2015 | -85 | 789 | 413 | 216 | 162 | -440 | -130 | 25 | -284 | 1,130 | 725 | 775 |
| 2016 | -175 | -179 | 571 | 111 | -580 | 385 | 39 | 429 | 655 | 266 | 388 | 523 |
| 2017 | 463 | 381 | 324 | 264 | 258 | 740 | 437 | 131 | 542 | 925 | 198 | -93 |
| 2018 | 554 | 875 | 498 | -177 | 131 | 585 | 582 | 64 | -78 | 202 | 503 | 573 |
| 2019 | 651 | -471 | -245 | -40 | 174 | 203 | 203 | -264 | 400 | 80 | 719 | -141 |
| 2020 | 273 | -636 | 522 | -266 | 370 | 154 | 157 | 352 | -325 | -186 | 226 | 133 |
| 2021 | 286 | -620 | -75 | 917 | -46 | 421 | 185 | 181 | 231 | -422 | 346 | 296 |
| 2022 | -251 | 713 | -879 | 146 | 109 | 377 | 351 | 434 | 242 | -265 | 414 | 564 |
| 2023 | 133 | -173 | -842 | -303 | 453 | 68 | 194 | 294 | -156 | 344 | 567 | 751 |
| 2024 | -25 | 162 | 52 | 172 | ||||||||
| - = No Data Reported; -- = Not Applicable; NA = Not Available; W = Withheld to avoid disclosure of individual company data. |
| Release Date: 6/28/2024 |
| Next Release Date: 7/31/2024 |