|
Download Data (XLS File) |
|
||||||||
|
||||||||
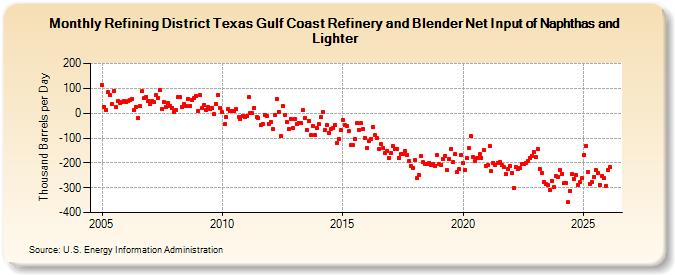
| Refining District Texas Gulf Coast Refinery and Blender Net Input of Naphthas and Lighter (Thousand Barrels per Day) | ||||||||
| Year | Jan | Feb | Mar | Apr | May | Jun | Jul | Aug | Sep | Oct | Nov | Dec |
|---|---|---|---|---|---|---|---|---|---|---|---|---|
| 2005 | 113 | 26 | 13 | 85 | 73 | 38 | 90 | 25 | 48 | 39 | 46 | 51 |
| 2006 | 44 | 51 | 54 | 58 | 11 | 24 | -18 | 29 | 88 | 60 | 67 | 47 |
| 2007 | 37 | 50 | 43 | 72 | 62 | 93 | 16 | 44 | 24 | 39 | 29 | 22 |
| 2008 | 4 | 12 | 66 | 64 | 23 | 36 | 28 | 59 | 29 | 55 | 60 | 70 |
| 2009 | 9 | 73 | 19 | 33 | 12 | 24 | 18 | 20 | -4 | 37 | 74 | 22 |
| 2010 | 3 | -44 | -17 | 16 | 8 | 9 | 7 | 15 | -16 | -22 | -13 | -14 |
| 2011 | -13 | 64 | 2 | 1 | 22 | -16 | -18 | -48 | -44 | -7 | -11 | -42 |
| 2012 | -35 | -64 | -9 | 59 | 6 | -93 | 28 | -9 | -37 | -64 | -22 | -59 |
| 2013 | -22 | -42 | -40 | -40 | 11 | -18 | -66 | -30 | -88 | -52 | -88 | -60 |
| 2014 | -44 | -16 | 4 | -69 | -47 | -79 | -64 | -60 | -48 | -121 | -103 | -68 |
| 2015 | -28 | -48 | -53 | -72 | -130 | -130 | -103 | -40 | -66 | -41 | -65 | -98 |
| 2016 | -140 | -110 | -102 | -55 | -89 | -101 | -144 | -123 | -141 | -159 | -151 | -180 |
| 2017 | -161 | -133 | -145 | -144 | -179 | -163 | -163 | -152 | -168 | -192 | -213 | -219 |
| 2018 | -189 | -262 | -249 | -173 | -197 | -206 | -205 | -200 | -210 | -205 | -212 | -168 |
| 2019 | -206 | -207 | -185 | -171 | -229 | -184 | -144 | -197 | -165 | -238 | -225 | -168 |
| 2020 | -202 | -229 | -182 | -142 | -93 | -175 | -191 | -179 | -166 | -179 | -149 | -211 |
| 2021 | -210 | -131 | -234 | -199 | -209 | -200 | -195 | -210 | -215 | -244 | -224 | -212 |
| 2022 | -241 | -303 | -216 | -224 | -219 | -205 | -205 | -202 | -192 | -181 | -172 | -155 |
| 2023 | -178 | -145 | -224 | -242 | -279 | -285 | -291 | -310 | -271 | -298 | -253 | -255 |
| 2024 | -228 | |||||||||||
| - = No Data Reported; -- = Not Applicable; NA = Not Available; W = Withheld to avoid disclosure of individual company data. |
| Release Date: 3/29/2024 |
| Next Release Date: 4/30/2024 |