|
Download Data (XLS File) |
|
||||||||
|
||||||||
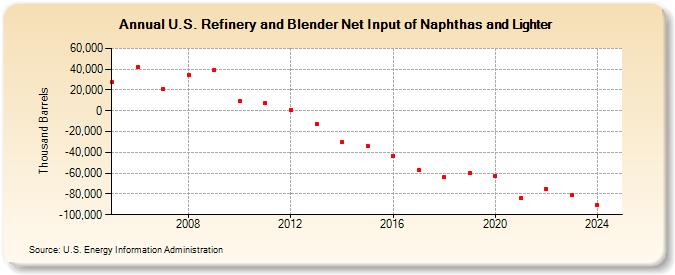
| U.S. Refinery and Blender Net Input of Naphthas and Lighter (Thousand Barrels) | ||||||||
| Decade | Year-0 | Year-1 | Year-2 | Year-3 | Year-4 | Year-5 | Year-6 | Year-7 | Year-8 | Year-9 |
|---|---|---|---|---|---|---|---|---|---|---|
| 2000's | 27,287 | 42,370 | 20,729 | 34,532 | 39,620 | |||||
| 2010's | 9,700 | 7,862 | 347 | -12,361 | -30,275 | -33,459 | -43,322 | -57,103 | -64,084 | -59,895 |
| 2020's | -62,432 | -83,487 | -75,127 | -80,950 |
| - = No Data Reported; -- = Not Applicable; NA = Not Available; W = Withheld to avoid disclosure of individual company data. |
| Release Date: 3/29/2024 |
| Next Release Date: 8/30/2024 |