|
Download Data (XLS File) |
|
||||||||
|
||||||||
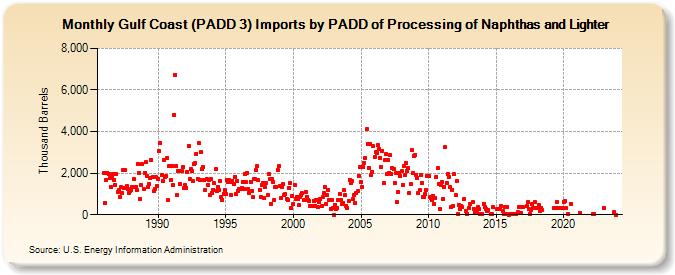
| Gulf Coast (PADD 3) Imports by PADD of Processing of Naphthas and Lighter (Thousand Barrels) | ||||||||
| Year | Jan | Feb | Mar | Apr | May | Jun | Jul | Aug | Sep | Oct | Nov | Dec |
|---|---|---|---|---|---|---|---|---|---|---|---|---|
| 1986 | 1,997 | 578 | 1,688 | 2,027 | 1,966 | 1,757 | 1,337 | 1,813 | 1,971 | 1,690 | 1,444 | 1,969 |
| 1987 | 1,094 | 1,173 | 868 | 1,330 | 1,037 | 2,165 | 1,297 | 2,143 | 1,369 | 1,250 | 1,063 | 1,160 |
| 1988 | 1,200 | 1,314 | 1,319 | 1,712 | 1,353 | 1,190 | 2,455 | 2,013 | 745 | 1,417 | 2,420 | 1,217 |
| 1989 | 2,030 | 2,517 | 1,868 | 1,337 | 1,472 | 1,774 | 2,648 | 1,828 | 1,128 | 1,250 | 1,809 | 1,372 |
| 1990 | 1,733 | 3,056 | 3,472 | 1,930 | 1,629 | 2,636 | 1,836 | 1,849 | 2,741 | 698 | 2,337 | 1,659 |
| 1991 | 2,324 | 1,420 | 4,814 | 6,736 | 2,355 | 953 | 2,111 | 1,497 | 2,117 | 2,116 | 2,292 | 1,274 |
| 1992 | 1,427 | 1,301 | 2,076 | 3,323 | 1,700 | 2,185 | 2,117 | 1,606 | 2,455 | 2,470 | 2,941 | 1,721 |
| 1993 | 3,434 | 1,651 | 3,011 | 2,182 | 2,296 | 1,659 | 1,196 | 1,709 | 1,445 | 1,692 | 972 | 1,696 |
| 1994 | 1,064 | 1,204 | 1,507 | 2,175 | 1,152 | 1,357 | 1,168 | 1,624 | 863 | 722 | 998 | 1,181 |
| 1995 | 975 | 1,692 | 1,597 | 1,689 | 1,559 | 956 | 1,642 | 1,474 | 1,836 | 977 | 1,619 | 1,154 |
| 1996 | 1,230 | 1,223 | 1,291 | 1,579 | 1,251 | 1,978 | 1,582 | 2,007 | 1,243 | 1,066 | 1,588 | 1,124 |
| 1997 | 828 | 1,712 | 1,711 | 2,127 | 2,327 | 1,671 | 1,191 | 861 | 1,415 | 1,514 | 815 | 1,314 |
| 1998 | 1,525 | 926 | 1,966 | 1,717 | 539 | 1,735 | 1,592 | 722 | 1,335 | 1,338 | 2,169 | 2,325 |
| 1999 | 1,361 | 799 | 1,313 | 1,475 | 961 | 996 | 777 | 709 | 1,286 | 1,531 | 311 | 882 |
| 2000 | 506 | 1,442 | 759 | 834 | 735 | 450 | 856 | 925 | 1,021 | 706 | 694 | 1,093 |
| 2001 | 864 | 722 | 649 | 442 | 429 | 402 | 660 | 432 | 685 | 685 | 355 | 607 |
| 2002 | 762 | 410 | 832 | 1,027 | 1,348 | 511 | 951 | 1,201 | 688 | 291 | 722 | 342 |
| 2003 | 0 | 474 | 288 | 301 | 702 | 1,014 | 729 | 499 | 567 | 1,167 | 941 | 423 |
| 2004 | 323 | 682 | 1,691 | 1,537 | 1,609 | 739 | 962 | 562 | 1,059 | 1,131 | 1,874 | 2,285 |
| 2005 | 1,559 | 1,309 | 2,301 | 2,509 | 2,738 | 4,110 | 3,393 | 2,256 | 3,408 | 1,898 | 2,074 | 3,286 |
| 2006 | 2,772 | 2,993 | 2,984 | 3,338 | 3,170 | 2,746 | 2,299 | 3,083 | 1,523 | 2,610 | 2,897 | 1,968 |
| 2007 | 2,653 | 2,025 | 2,864 | 1,967 | 2,240 | 2,221 | 1,540 | 2,003 | 619 | 1,098 | 2,001 | 1,860 |
| 2008 | 2,098 | 1,445 | 2,359 | 1,897 | 2,499 | 2,079 | 2,226 | 1,060 | 1,493 | 3,090 | 2,024 | 2,838 |
| 2009 | 2,887 | 1,895 | 1,786 | 1,064 | 1,172 | 1,892 | 1,506 | 862 | 857 | 993 | 1,166 | 1,846 |
| 2010 | 1,845 | 847 | 801 | 726 | 910 | 516 | 785 | 1,826 | 2,233 | 1,496 | 271 | 1,440 |
| 2011 | 1,571 | 769 | 1,337 | 3,254 | 1,545 | 1,965 | 1,822 | 1,323 | 350 | 1,209 | 425 | 1,942 |
| 2012 | 934 | 1,607 | 32 | 470 | 280 | 421 | 361 | 732 | 195 | 40 | ||
| 2013 | 337 | 498 | 598 | 294 | 105 | 189 | 92 | 374 | 274 | 40 | 54 | |
| 2014 | 531 | 355 | 290 | 202 | 239 | 20 | 21 | 351 | ||||
| 2015 | 281 | 288 | 400 | 179 | 17 | 358 | 39 | 364 | 10 | |||
| 2016 | 45 | 36 | 40 | 38 | 16 | 109 | 386 | 65 | 371 | |||
| 2017 | 364 | 402 | 607 | 272 | 20 | 246 | 524 | 315 | 603 | 320 | ||
| 2018 | 328 | 312 | 488 | 200 | 336 | 215 | ||||||
| 2019 | 326 | 322 | 325 | 634 | 322 | 330 | 323 | 315 | ||||
| 2020 | 625 | 639 | 327 | 52 | 504 | |||||||
| 2021 | 104 | |||||||||||
| 2022 | 45 | 45 | ||||||||||
| 2023 | 317 | 111 | 1 | |||||||||
| - = No Data Reported; -- = Not Applicable; NA = Not Available; W = Withheld to avoid disclosure of individual company data. |
| Release Date: 3/29/2024 |
| Next Release Date: 4/30/2024 |