|
Download Data (XLS File) |
|
||||||||
|
||||||||
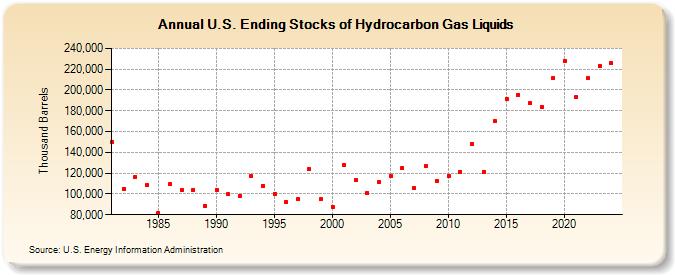
| U.S. Ending Stocks of Hydrocarbon Gas Liquids (Thousand Barrels) | ||||||||
| Decade | Year-0 | Year-1 | Year-2 | Year-3 | Year-4 | Year-5 | Year-6 | Year-7 | Year-8 | Year-9 |
|---|---|---|---|---|---|---|---|---|---|---|
| 1980's | 150,170 | 105,077 | 116,532 | 108,446 | 81,707 | 109,532 | 104,119 | 103,988 | 88,806 | |
| 1990's | 104,038 | 99,630 | 97,826 | 117,065 | 108,026 | 100,199 | 92,579 | 95,196 | 123,760 | 94,721 |
| 2000's | 87,722 | 128,272 | 113,285 | 100,889 | 111,085 | 117,412 | 125,109 | 105,870 | 126,909 | 112,628 |
| 2010's | 117,634 | 121,323 | 148,094 | 121,284 | 170,102 | 191,512 | 195,509 | 187,435 | 183,861 | 211,696 |
| 2020's | 228,168 | 193,052 | 211,150 | 223,331 |
| - = No Data Reported; -- = Not Applicable; NA = Not Available; W = Withheld to avoid disclosure of individual company data. |
| Release Date: 3/29/2024 |
| Next Release Date: 8/30/2024 |