|
Download Data (XLS File) |
|
||||||||
|
||||||||
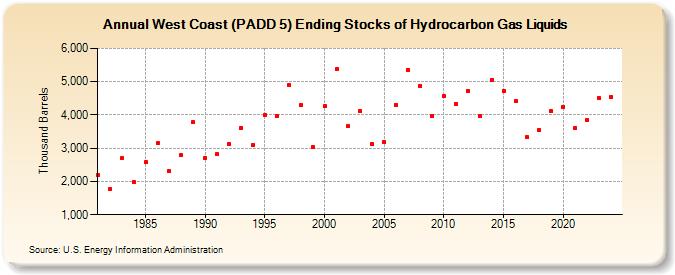
| West Coast (PADD 5) Ending Stocks of Hydrocarbon Gas Liquids (Thousand Barrels) | ||||||||
| Decade | Year-0 | Year-1 | Year-2 | Year-3 | Year-4 | Year-5 | Year-6 | Year-7 | Year-8 | Year-9 |
|---|---|---|---|---|---|---|---|---|---|---|
| 1980's | 2,203 | 1,771 | 2,695 | 1,984 | 2,576 | 3,141 | 2,303 | 2,795 | 3,778 | |
| 1990's | 2,715 | 2,816 | 3,131 | 3,615 | 3,094 | 4,001 | 3,953 | 4,906 | 4,304 | 3,030 |
| 2000's | 4,261 | 5,371 | 3,657 | 4,108 | 3,131 | 3,189 | 4,308 | 5,358 | 4,882 | 3,969 |
| 2010's | 4,568 | 4,330 | 4,734 | 3,959 | 5,063 | 4,729 | 4,409 | 3,328 | 3,551 | 4,114 |
| 2020's | 4,253 | 3,607 | 3,848 | 4,503 |
| - = No Data Reported; -- = Not Applicable; NA = Not Available; W = Withheld to avoid disclosure of individual company data. |
| Release Date: 3/29/2024 |
| Next Release Date: 8/30/2024 |