|
Download Data (XLS File) |
|
||||||||
|
||||||||
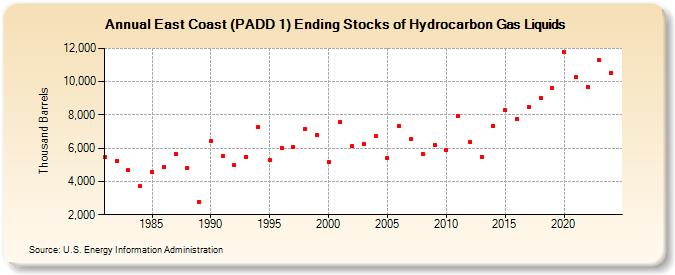
| East Coast (PADD 1) Ending Stocks of Hydrocarbon Gas Liquids (Thousand Barrels) | ||||||||
| Decade | Year-0 | Year-1 | Year-2 | Year-3 | Year-4 | Year-5 | Year-6 | Year-7 | Year-8 | Year-9 |
|---|---|---|---|---|---|---|---|---|---|---|
| 1980's | 5,481 | 5,252 | 4,676 | 3,705 | 4,573 | 4,890 | 5,670 | 4,832 | 2,783 | |
| 1990's | 6,437 | 5,527 | 4,974 | 5,492 | 7,269 | 5,307 | 6,039 | 6,092 | 7,169 | 6,812 |
| 2000's | 5,163 | 7,599 | 6,126 | 6,251 | 6,713 | 5,389 | 7,347 | 6,581 | 5,659 | 6,187 |
| 2010's | 5,915 | 7,965 | 6,377 | 5,487 | 7,332 | 8,282 | 7,767 | 8,483 | 9,037 | 9,642 |
| 2020's | 11,759 | 10,303 | 9,708 | 11,232 |
| - = No Data Reported; -- = Not Applicable; NA = Not Available; W = Withheld to avoid disclosure of individual company data. |
| Release Date: 6/28/2024 |
| Next Release Date: 8/30/2024 |