|
Download Data (XLS File) |
|
||||||||
|
||||||||
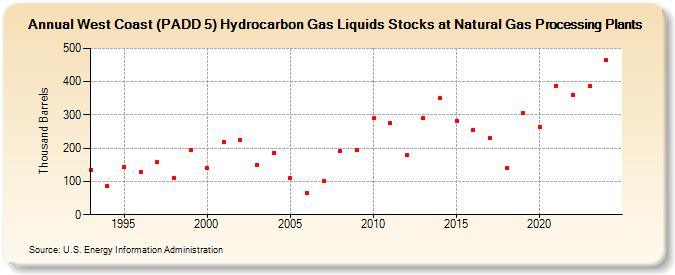
| West Coast (PADD 5) Hydrocarbon Gas Liquids Stocks at Natural Gas Processing Plants (Thousand Barrels) | ||||||||
| Decade | Year-0 | Year-1 | Year-2 | Year-3 | Year-4 | Year-5 | Year-6 | Year-7 | Year-8 | Year-9 |
|---|---|---|---|---|---|---|---|---|---|---|
| 1990's | 135 | 87 | 143 | 127 | 159 | 110 | 195 | |||
| 2000's | 139 | 220 | 224 | 149 | 187 | 110 | 65 | 101 | 191 | 196 |
| 2010's | 290 | 277 | 181 | 291 | 350 | 282 | 255 | 232 | 139 | 306 |
| 2020's | 265 | 388 | 361 | 386 |
| - = No Data Reported; -- = Not Applicable; NA = Not Available; W = Withheld to avoid disclosure of individual company data. |
| Release Date: 8/30/2024 |
| Next Release Date: 8/29/2025 |