|
Download Data (XLS File) |
|
||||||||
|
||||||||
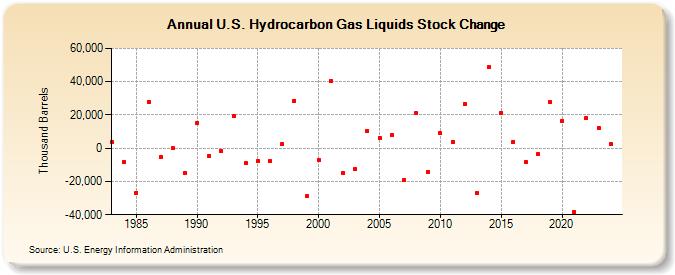
| U.S. Hydrocarbon Gas Liquids Stock Change (Thousand Barrels) | ||||||||
| Decade | Year-0 | Year-1 | Year-2 | Year-3 | Year-4 | Year-5 | Year-6 | Year-7 | Year-8 | Year-9 |
|---|---|---|---|---|---|---|---|---|---|---|
| 1980's | 3,421 | -8,086 | -26,739 | 27,825 | -5,413 | -131 | -15,182 | |||
| 1990's | 15,232 | -4,408 | -1,804 | 19,239 | -9,039 | -7,827 | -7,620 | 2,617 | 28,564 | -29,039 |
| 2000's | -6,999 | 40,550 | -14,987 | -12,396 | 10,196 | 6,327 | 7,697 | -19,239 | 21,039 | -14,281 |
| 2010's | 9,099 | 3,689 | 26,771 | -26,810 | 48,818 | 21,410 | 3,997 | -8,074 | -3,574 | 27,835 |
| 2020's | 16,472 | -38,176 | 18,097 | 12,246 |
| - = No Data Reported; -- = Not Applicable; NA = Not Available; W = Withheld to avoid disclosure of individual company data. |
| Release Date: 3/29/2024 |
| Next Release Date: 8/30/2024 |