|
Download Data (XLS File) |
|
||||||||
|
||||||||
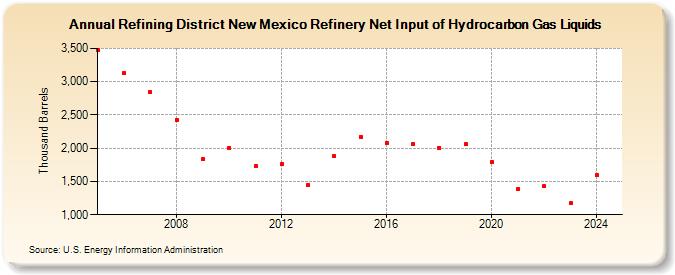
| Refining District New Mexico Refinery Net Input of Hydrocarbon Gas Liquids (Thousand Barrels) | ||||||||
| Decade | Year-0 | Year-1 | Year-2 | Year-3 | Year-4 | Year-5 | Year-6 | Year-7 | Year-8 | Year-9 |
|---|---|---|---|---|---|---|---|---|---|---|
| 2000's | 3,470 | 3,130 | 2,839 | 2,430 | 1,830 | |||||
| 2010's | 2,007 | 1,726 | 1,760 | 1,447 | 1,877 | 2,173 | 2,083 | 2,060 | 2,005 | 2,062 |
| 2020's | 1,796 | 1,385 | 1,427 | 1,169 |
| - = No Data Reported; -- = Not Applicable; NA = Not Available; W = Withheld to avoid disclosure of individual company data. |
| Release Date: 3/29/2024 |
| Next Release Date: 8/30/2024 |