|
Download Data (XLS File) |
|
||||||||
|
||||||||
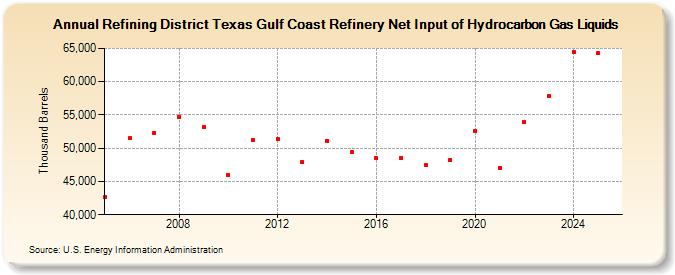
| Refining District Texas Gulf Coast Refinery Net Input of Hydrocarbon Gas Liquids (Thousand Barrels) | ||||||||
| Decade | Year-0 | Year-1 | Year-2 | Year-3 | Year-4 | Year-5 | Year-6 | Year-7 | Year-8 | Year-9 |
|---|---|---|---|---|---|---|---|---|---|---|
| 2000's | 42,624 | 51,568 | 52,306 | 54,746 | 53,160 | |||||
| 2010's | 45,910 | 51,288 | 51,353 | 47,937 | 51,131 | 49,378 | 48,470 | 48,568 | 47,411 | 48,255 |
| 2020's | 52,572 | 47,064 | 53,960 | 57,779 |
| - = No Data Reported; -- = Not Applicable; NA = Not Available; W = Withheld to avoid disclosure of individual company data. |
| Release Date: 3/29/2024 |
| Next Release Date: 8/30/2024 |