|
Download Data (XLS File) |
|
||||||||
|
||||||||
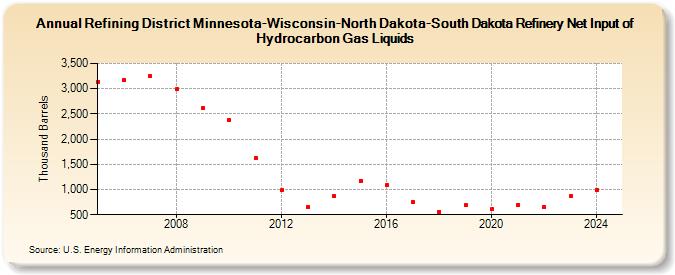
| Refining District Minnesota-Wisconsin-North Dakota-South Dakota Refinery Net Input of Hydrocarbon Gas Liquids (Thousand Barrels) | ||||||||
| Decade | Year-0 | Year-1 | Year-2 | Year-3 | Year-4 | Year-5 | Year-6 | Year-7 | Year-8 | Year-9 |
|---|---|---|---|---|---|---|---|---|---|---|
| 2000's | 3,141 | 3,172 | 3,246 | 2,987 | 2,607 | |||||
| 2010's | 2,370 | 1,627 | 984 | 653 | 871 | 1,174 | 1,080 | 746 | 561 | 683 |
| 2020's | 605 | 694 | 651 | 866 |
| - = No Data Reported; -- = Not Applicable; NA = Not Available; W = Withheld to avoid disclosure of individual company data. |
| Release Date: 6/28/2024 |
| Next Release Date: 8/30/2024 |