|
Download Data (XLS File) |
|
||||||||
|
||||||||
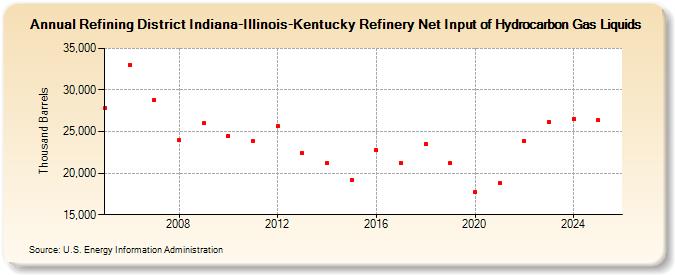
| Refining District Indiana-Illinois-Kentucky Refinery Net Input of Hydrocarbon Gas Liquids (Thousand Barrels) | ||||||||
| Decade | Year-0 | Year-1 | Year-2 | Year-3 | Year-4 | Year-5 | Year-6 | Year-7 | Year-8 | Year-9 |
|---|---|---|---|---|---|---|---|---|---|---|
| 2000's | 27,781 | 33,034 | 28,842 | 23,927 | 25,971 | |||||
| 2010's | 24,468 | 23,832 | 25,630 | 22,418 | 21,185 | 19,203 | 22,743 | 21,200 | 23,507 | 21,215 |
| 2020's | 17,721 | 18,756 | 23,892 | 26,020 |
| - = No Data Reported; -- = Not Applicable; NA = Not Available; W = Withheld to avoid disclosure of individual company data. |
| Release Date: 3/29/2024 |
| Next Release Date: 8/30/2024 |