|
Download Data (XLS File) |
|
||||||||
|
||||||||
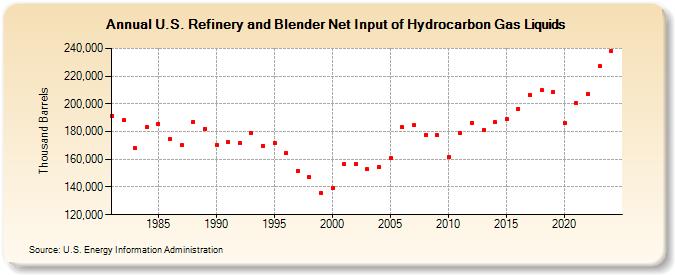
| U.S. Refinery and Blender Net Input of Hydrocarbon Gas Liquids (Thousand Barrels) | ||||||||
| Decade | Year-0 | Year-1 | Year-2 | Year-3 | Year-4 | Year-5 | Year-6 | Year-7 | Year-8 | Year-9 |
|---|---|---|---|---|---|---|---|---|---|---|
| 1980's | 191,102 | 188,051 | 167,931 | 183,022 | 185,804 | 174,778 | 170,009 | 186,902 | 182,109 | |
| 1990's | 170,589 | 172,306 | 171,701 | 179,213 | 169,868 | 172,026 | 164,552 | 151,769 | 146,921 | 135,756 |
| 2000's | 138,921 | 156,479 | 156,429 | 152,763 | 154,356 | 161,037 | 182,924 | 184,383 | 177,559 | 177,194 |
| 2010's | 161,479 | 178,884 | 186,270 | 181,112 | 186,601 | 188,722 | 196,281 | 206,629 | 209,708 | 208,501 |
| 2020's | 185,968 | 200,325 | 207,362 | 226,885 |
| - = No Data Reported; -- = Not Applicable; NA = Not Available; W = Withheld to avoid disclosure of individual company data. |
| Release Date: 3/29/2024 |
| Next Release Date: 8/30/2024 |