|
Download Data (XLS File) |
|
||||||||
|
||||||||
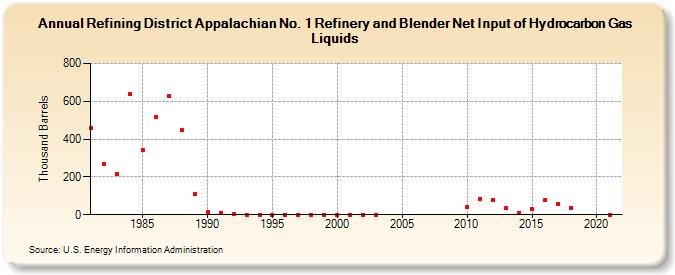
| Refining District Appalachian No. 1 Refinery and Blender Net Input of Hydrocarbon Gas Liquids (Thousand Barrels) | ||||||||
| Decade | Year-0 | Year-1 | Year-2 | Year-3 | Year-4 | Year-5 | Year-6 | Year-7 | Year-8 | Year-9 |
|---|---|---|---|---|---|---|---|---|---|---|
| 1980's | 458 | 267 | 218 | 638 | 343 | 515 | 630 | 449 | 108 | |
| 1990's | 13 | 10 | 2 | 0 | 0 | 0 | 0 | 0 | 0 | 0 |
| 2000's | 0 | 0 | 0 | 0 | ||||||
| 2010's | 43 | 84 | 80 | 36 | 8 | 30 | 79 | 59 | 38 | |
| 2020's | 1 |
| - = No Data Reported; -- = Not Applicable; NA = Not Available; W = Withheld to avoid disclosure of individual company data. |
| Release Date: 6/28/2024 |
| Next Release Date: 8/30/2024 |