|
Download Data (XLS File) |
|
||||||||
|
||||||||
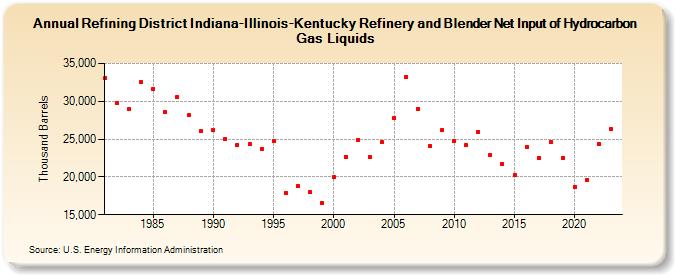
| Refining District Indiana-Illinois-Kentucky Refinery and Blender Net Input of Hydrocarbon Gas Liquids (Thousand Barrels) | ||||||||
| Decade | Year-0 | Year-1 | Year-2 | Year-3 | Year-4 | Year-5 | Year-6 | Year-7 | Year-8 | Year-9 |
|---|---|---|---|---|---|---|---|---|---|---|
| 1980's | 33,051 | 29,775 | 28,923 | 32,511 | 31,645 | 28,528 | 30,618 | 28,137 | 26,070 | |
| 1990's | 26,226 | 25,003 | 24,210 | 24,351 | 23,703 | 24,691 | 17,916 | 18,846 | 18,007 | 16,561 |
| 2000's | 20,012 | 22,687 | 24,933 | 22,618 | 24,580 | 27,813 | 33,219 | 29,039 | 24,128 | 26,211 |
| 2010's | 24,808 | 24,199 | 25,975 | 22,955 | 21,742 | 20,215 | 24,012 | 22,496 | 24,588 | 22,520 |
| 2020's | 18,638 | 19,634 | 24,352 | 26,313 |
| - = No Data Reported; -- = Not Applicable; NA = Not Available; W = Withheld to avoid disclosure of individual company data. |
| Release Date: 6/28/2024 |
| Next Release Date: 8/30/2024 |