|
Download Data (XLS File) |
|
||||||||
|
||||||||
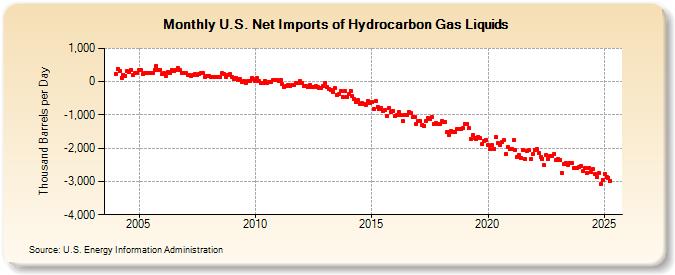
| U.S. Net Imports of Hydrocarbon Gas Liquids (Thousand Barrels per Day) | ||||||||
| Year | Jan | Feb | Mar | Apr | May | Jun | Jul | Aug | Sep | Oct | Nov | Dec |
|---|---|---|---|---|---|---|---|---|---|---|---|---|
| 2004 | 243 | 391 | 311 | 121 | 202 | 184 | 317 | 283 | 363 | 208 | 249 | 248 |
| 2005 | 343 | 336 | 228 | 273 | 271 | 275 | 275 | 247 | 349 | 468 | 358 | 359 |
| 2006 | 228 | 247 | 175 | 301 | 273 | 346 | 312 | 365 | 406 | 346 | 250 | 251 |
| 2007 | 257 | 193 | 208 | 165 | 191 | 237 | 188 | 219 | 256 | 255 | 133 | 171 |
| 2008 | 182 | 152 | 148 | 153 | 136 | 125 | 134 | 251 | 229 | 143 | 202 | 229 |
| 2009 | 149 | 82 | 123 | 46 | 89 | 3 | 13 | -50 | 15 | 18 | 105 | 68 |
| 2010 | 31 | 96 | 8 | -41 | -38 | 27 | -29 | 3 | 2 | 35 | 40 | 52 |
| 2011 | 6 | 62 | -66 | -159 | -143 | -97 | -128 | -103 | -96 | -30 | -43 | 13 |
| 2012 | -44 | -132 | -133 | -153 | -108 | -174 | -159 | -145 | -171 | -191 | -200 | -125 |
| 2013 | -32 | -168 | -228 | -239 | -301 | -194 | -396 | -385 | -292 | -452 | -285 | -452 |
| 2014 | -380 | -272 | -424 | -531 | -622 | -555 | -680 | -652 | -660 | -688 | -580 | -655 |
| 2015 | -612 | -824 | -584 | -753 | -831 | -800 | -874 | -851 | -1,021 | -794 | -905 | -886 |
| 2016 | -1,026 | -995 | -925 | -1,008 | -1,195 | -996 | -999 | -900 | -951 | -1,064 | -1,048 | -1,258 |
| 2017 | -1,169 | -1,184 | -1,288 | -1,323 | -1,179 | -1,094 | -1,130 | -1,071 | -1,272 | -1,246 | -1,272 | -1,275 |
| 2018 | -1,183 | -1,206 | -1,211 | -1,502 | -1,595 | -1,483 | -1,502 | -1,500 | -1,411 | -1,416 | -1,431 | -1,403 |
| 2019 | -1,264 | -1,271 | -1,397 | -1,715 | -1,618 | -1,690 | -1,713 | -1,654 | -1,708 | -1,883 | -1,791 | -1,755 |
| 2020 | -1,914 | -2,035 | -1,906 | -2,010 | -1,670 | -1,859 | -1,903 | -1,822 | -1,762 | -2,171 | -1,969 | -2,039 |
| 2021 | -2,026 | -1,763 | -2,046 | -2,254 | -2,214 | -2,295 | -2,050 | -2,325 | -2,081 | -2,069 | -2,316 | -2,166 |
| 2022 | -2,043 | -2,026 | -2,133 | -2,266 | -2,311 | -2,518 | -2,200 | -2,315 | -2,234 | -2,227 | -2,176 | -2,361 |
| 2023 | -2,338 | -2,415 | -2,637 | -2,482 | -2,284 | -2,398 | -2,369 | -2,368 | -2,535 | -2,507 | -2,624 | -2,608 |
| 2024 | -2,522 | |||||||||||
| - = No Data Reported; -- = Not Applicable; NA = Not Available; W = Withheld to avoid disclosure of individual company data. |
| Release Date: 3/29/2024 |
| Next Release Date: 4/30/2024 |