|
Download Data (XLS File) |
|
||||||||
|
||||||||
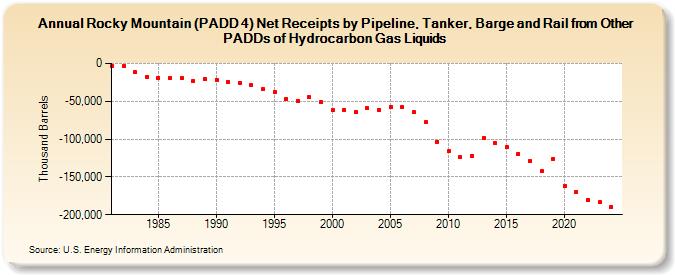
| Rocky Mountain (PADD 4) Net Receipts by Pipeline, Tanker, Barge and Rail from Other PADDs of Hydrocarbon Gas Liquids (Thousand Barrels) | ||||||||
| Decade | Year-0 | Year-1 | Year-2 | Year-3 | Year-4 | Year-5 | Year-6 | Year-7 | Year-8 | Year-9 |
|---|---|---|---|---|---|---|---|---|---|---|
| 1980's | -3,137 | -3,306 | -11,679 | -17,526 | -18,816 | -18,935 | -18,894 | -23,008 | -20,580 | |
| 1990's | -21,256 | -24,493 | -25,404 | -28,790 | -34,276 | -37,718 | -46,676 | -48,958 | -44,790 | -51,338 |
| 2000's | -62,051 | -61,179 | -64,276 | -59,313 | -61,068 | -57,868 | -57,585 | -64,309 | -78,020 | -103,208 |
| 2010's | -116,329 | -124,076 | -122,092 | -99,153 | -105,189 | -110,465 | -119,259 | -129,014 | -142,208 | -125,896 |
| 2020's | -161,697 | -169,975 | -180,540 | -183,080 |
| - = No Data Reported; -- = Not Applicable; NA = Not Available; W = Withheld to avoid disclosure of individual company data. |
| Release Date: 8/30/2024 |
| Next Release Date: 8/29/2025 |