|
Download Data (XLS File) |
|
||||||||
|
||||||||
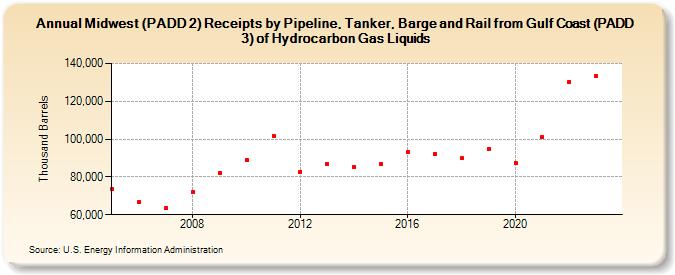
| Midwest (PADD 2) Receipts by Pipeline, Tanker, Barge and Rail from Gulf Coast (PADD 3) of Hydrocarbon Gas Liquids (Thousand Barrels) | ||||||||
| Decade | Year-0 | Year-1 | Year-2 | Year-3 | Year-4 | Year-5 | Year-6 | Year-7 | Year-8 | Year-9 |
|---|---|---|---|---|---|---|---|---|---|---|
| 2000's | 73,370 | 66,778 | 63,639 | 72,145 | 82,183 | |||||
| 2010's | 89,042 | 101,872 | 82,844 | 86,780 | 85,334 | 86,788 | 92,980 | 92,339 | 89,831 | 94,816 |
| 2020's | 87,483 | 101,224 | 130,318 | 133,558 |
| - = No Data Reported; -- = Not Applicable; NA = Not Available; W = Withheld to avoid disclosure of individual company data. |
| Release Date: 8/30/2024 |
| Next Release Date: 8/29/2025 |