|
Download Data (XLS File) |
|
||||||||
|
||||||||
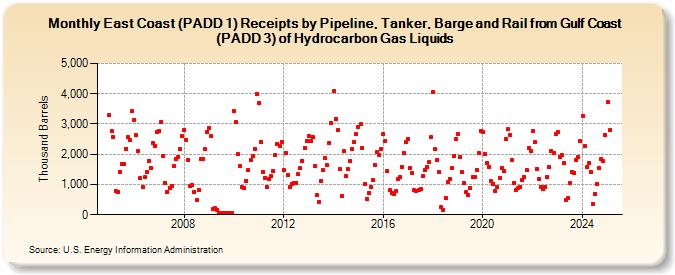
| East Coast (PADD 1) Receipts by Pipeline, Tanker, Barge and Rail from Gulf Coast (PADD 3) of Hydrocarbon Gas Liquids (Thousand Barrels) | ||||||||
| Year | Jan | Feb | Mar | Apr | May | Jun | Jul | Aug | Sep | Oct | Nov | Dec |
|---|---|---|---|---|---|---|---|---|---|---|---|---|
| 2005 | 3,300 | 2,777 | 2,581 | 795 | 761 | 1,417 | 1,672 | 1,679 | 2,184 | 2,573 | 2,457 | 3,421 |
| 2006 | 3,143 | 2,620 | 2,109 | 1,202 | 913 | 1,233 | 1,415 | 1,788 | 1,546 | 2,369 | 2,281 | 2,740 |
| 2007 | 2,773 | 3,060 | 1,954 | 1,048 | 762 | 896 | 939 | 1,597 | 1,849 | 1,898 | 2,188 | 2,589 |
| 2008 | 2,812 | 2,473 | 1,809 | 948 | 987 | 760 | 485 | 820 | 1,842 | 1,844 | 2,178 | 2,732 |
| 2009 | 2,852 | 2,603 | 205 | 207 | 162 | 44 | 50 | 50 | 44 | 46 | 45 | 64 |
| 2010 | 3,434 | 3,071 | 2,007 | 1,614 | 905 | 890 | 1,115 | 1,482 | 1,803 | 1,945 | 2,172 | 4,003 |
| 2011 | 3,704 | 2,402 | 1,413 | 1,227 | 905 | 1,190 | 1,271 | 1,452 | 1,974 | 2,351 | 2,272 | 2,417 |
| 2012 | 1,469 | 2,052 | 1,311 | 929 | 1,031 | 1,047 | 1,050 | 1,333 | 1,533 | 1,792 | 2,210 | 2,434 |
| 2013 | 2,616 | 2,431 | 2,568 | 1,598 | 639 | 427 | 1,130 | 1,472 | 1,865 | 1,629 | 2,386 | 3,036 |
| 2014 | 4,090 | 3,168 | 2,789 | 1,497 | 625 | 2,097 | 1,264 | 1,511 | 1,789 | 2,166 | 2,399 | 2,659 |
| 2015 | 2,906 | 2,986 | 2,218 | 1,009 | 516 | 727 | 905 | 1,151 | 1,628 | 2,062 | 1,966 | 2,179 |
| 2016 | 2,682 | 2,442 | 1,451 | 807 | 715 | 698 | 790 | 1,191 | 1,231 | 1,587 | 2,042 | 2,393 |
| 2017 | 2,504 | 1,552 | 1,394 | 805 | 786 | 806 | 852 | 1,272 | 1,482 | 1,585 | 1,744 | 2,555 |
| 2018 | 4,053 | 2,162 | 1,814 | 1,411 | 241 | 151 | 553 | 1,068 | 1,184 | 1,557 | 1,938 | 2,517 |
| 2019 | 2,666 | 1,903 | 1,410 | 1,044 | 737 | 659 | 891 | 1,253 | 1,256 | 1,492 | 2,041 | 2,771 |
| 2020 | 2,727 | 1,995 | 1,709 | 1,569 | 1,118 | 1,028 | 770 | 907 | 1,226 | 1,560 | 1,436 | 2,505 |
| 2021 | 2,841 | 2,632 | 1,793 | 1,064 | 816 | 870 | 925 | 1,132 | 1,235 | 1,480 | 2,190 | 2,114 |
| 2022 | 2,759 | 2,390 | 1,523 | 1,184 | 912 | 864 | 927 | 1,244 | 1,573 | 2,110 | 2,047 | 2,676 |
| 2023 | 2,751 | 1,920 | 1,966 | 1,709 | 496 | 560 | 1,045 | 1,407 | 1,388 | 1,823 | 1,914 | 2,421 |
| 2024 | 3,268 | 2,264 | 1,555 | 1,699 | ||||||||
| - = No Data Reported; -- = Not Applicable; NA = Not Available; W = Withheld to avoid disclosure of individual company data. |
| Release Date: 6/28/2024 |
| Next Release Date: 7/31/2024 |