|
Download Data (XLS File) |
|
||||||||
|
||||||||
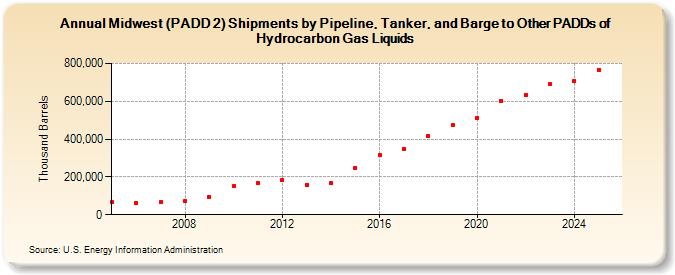
| Midwest (PADD 2) Shipments by Pipeline, Tanker, and Barge to Other PADDs of Hydrocarbon Gas Liquids (Thousand Barrels) | ||||||||
| Decade | Year-0 | Year-1 | Year-2 | Year-3 | Year-4 | Year-5 | Year-6 | Year-7 | Year-8 | Year-9 |
|---|---|---|---|---|---|---|---|---|---|---|
| 2000's | 66,129 | 61,344 | 67,068 | 73,528 | 95,068 | |||||
| 2010's | 151,281 | 167,509 | 181,989 | 158,524 | 165,788 | 247,442 | 316,587 | 349,635 | 417,412 | 473,474 |
| 2020's | 512,289 | 602,328 | 634,939 | 685,957 |
| - = No Data Reported; -- = Not Applicable; NA = Not Available; W = Withheld to avoid disclosure of individual company data. |
| Release Date: 6/28/2024 |
| Next Release Date: 8/30/2024 |