|
Download Data (XLS File) |
|
||||||||
|
||||||||
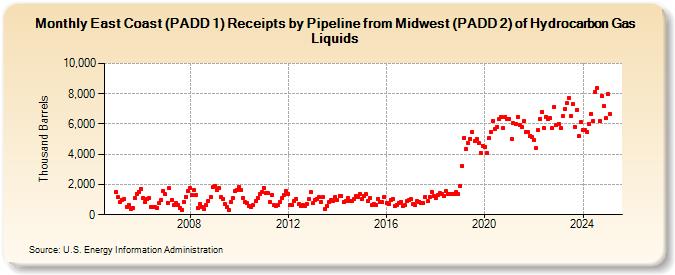
| East Coast (PADD 1) Receipts by Pipeline from Midwest (PADD 2) of Hydrocarbon Gas Liquids (Thousand Barrels) | ||||||||
| Year | Jan | Feb | Mar | Apr | May | Jun | Jul | Aug | Sep | Oct | Nov | Dec |
|---|---|---|---|---|---|---|---|---|---|---|---|---|
| 2005 | 1,488 | 1,152 | 835 | 946 | 1,054 | 539 | 659 | 376 | 461 | 1,114 | 1,370 | 1,528 |
| 2006 | 1,716 | 1,119 | 813 | 1,019 | 1,078 | 511 | 523 | 487 | 474 | 778 | 978 | 1,580 |
| 2007 | 1,346 | 799 | 1,739 | 974 | 633 | 775 | 628 | 426 | 337 | 852 | 1,203 | 1,581 |
| 2008 | 1,747 | 1,271 | 1,630 | 1,316 | 418 | 711 | 499 | 350 | 640 | 938 | 1,184 | 1,813 |
| 2009 | 1,906 | 1,636 | 1,742 | 1,140 | 1,061 | 738 | 490 | 284 | 859 | 1,096 | 1,564 | 1,662 |
| 2010 | 1,854 | 1,614 | 1,128 | 849 | 754 | 609 | 488 | 638 | 919 | 1,121 | 1,340 | 1,512 |
| 2011 | 1,796 | 1,412 | 1,414 | 863 | 1,293 | 619 | 574 | 617 | 865 | 1,073 | 1,302 | 1,539 |
| 2012 | 1,378 | 616 | 631 | 889 | 1,052 | 679 | 568 | 643 | 581 | 727 | 1,026 | 1,493 |
| 2013 | 772 | 969 | 1,070 | 1,141 | 854 | 1,184 | 364 | 571 | 866 | 1,000 | 913 | 1,182 |
| 2014 | 989 | 1,246 | 1,223 | 825 | 883 | 1,086 | 917 | 889 | 1,008 | 1,263 | 1,173 | 1,382 |
| 2015 | 1,051 | 1,251 | 1,352 | 906 | 1,121 | 617 | 681 | 652 | 1,047 | 837 | 821 | 1,180 |
| 2016 | 770 | 725 | 986 | 1,072 | 546 | 656 | 786 | 863 | 608 | 612 | 875 | 943 |
| 2017 | 1,022 | 718 | 636 | 887 | 867 | 801 | 743 | 1,166 | 900 | 1,168 | 1,532 | 1,231 |
| 2018 | 1,127 | 1,313 | 1,416 | 1,358 | 1,233 | 1,556 | 1,353 | 1,346 | 1,346 | 1,397 | 1,503 | 1,372 |
| 2019 | 1,918 | 3,226 | 5,090 | 4,336 | 4,716 | 5,030 | 5,438 | 4,864 | 4,999 | 4,713 | 4,100 | 4,554 |
| 2020 | 4,462 | 4,051 | 5,040 | 5,489 | 6,197 | 5,689 | 5,802 | 6,301 | 6,464 | 5,721 | 6,468 | 6,358 |
| 2021 | 6,332 | 5,008 | 6,033 | 5,986 | 6,475 | 5,924 | 5,789 | 6,200 | 5,452 | 5,478 | 5,193 | 5,127 |
| 2022 | 4,929 | 4,394 | 5,599 | 6,333 | 6,813 | 5,726 | 6,482 | 6,326 | 6,364 | 5,706 | 7,150 | 5,910 |
| 2023 | 6,014 | 5,731 | 4,507 | 6,227 | 7,362 | 7,724 | 6,520 | 7,305 | 5,806 | 6,953 | 5,200 | 5,303 |
| 2024 | 5,632 | |||||||||||
| - = No Data Reported; -- = Not Applicable; NA = Not Available; W = Withheld to avoid disclosure of individual company data. |
| Release Date: 3/29/2024 |
| Next Release Date: 4/30/2024 |