|
Download Data (XLS File) |
|
||||||||
|
||||||||
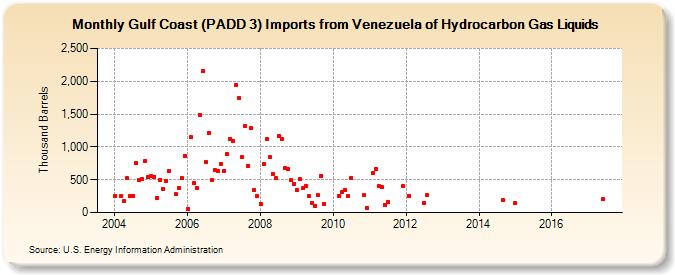
| Gulf Coast (PADD 3) Imports from Venezuela of Hydrocarbon Gas Liquids (Thousand Barrels) | ||||||||
| Year | Jan | Feb | Mar | Apr | May | Jun | Jul | Aug | Sep | Oct | Nov | Dec |
|---|---|---|---|---|---|---|---|---|---|---|---|---|
| 2004 | 259 | 251 | 169 | 520 | 248 | 258 | 750 | 500 | 510 | 785 | 535 | |
| 2005 | 555 | 549 | 228 | 502 | 356 | 483 | 640 | 276 | 372 | 521 | 862 | |
| 2006 | 57 | 1,150 | 445 | 381 | 1,493 | 2,154 | 769 | 1,219 | 499 | 642 | 634 | 745 |
| 2007 | 637 | 892 | 1,124 | 1,096 | 1,941 | 1,741 | 840 | 1,313 | 715 | 1,286 | 341 | 248 |
| 2008 | 135 | 733 | 1,123 | 840 | 594 | 522 | 1,165 | 1,123 | 673 | 661 | 495 | 441 |
| 2009 | 350 | 511 | 370 | 404 | 251 | 150 | 100 | 261 | 562 | 131 | ||
| 2010 | 249 | 306 | 336 | 251 | 528 | 263 | 71 | |||||
| 2011 | 609 | 663 | 400 | 385 | 121 | 164 | 405 | |||||
| 2012 | 248 | 150 | 260 | |||||||||
| 2014 | 185 | |||||||||||
| 2015 | 149 | |||||||||||
| 2017 | 199 | |||||||||||
| - = No Data Reported; -- = Not Applicable; NA = Not Available; W = Withheld to avoid disclosure of individual company data. |
| Release Date: 8/30/2024 |
| Next Release Date: 9/30/2024 |