|
Download Data (XLS File) |
|
||||||||
|
||||||||
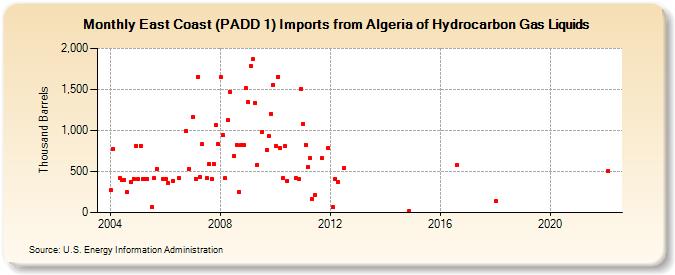
| East Coast (PADD 1) Imports from Algeria of Hydrocarbon Gas Liquids (Thousand Barrels) | ||||||||
| Year | Jan | Feb | Mar | Apr | May | Jun | Jul | Aug | Sep | Oct | Nov | Dec |
|---|---|---|---|---|---|---|---|---|---|---|---|---|
| 2004 | 270 | 773 | 418 | 398 | 399 | 246 | 373 | 414 | 814 | |||
| 2005 | 405 | 815 | 404 | 414 | 413 | 63 | 415 | 534 | 404 | |||
| 2006 | 403 | 366 | 382 | 415 | 998 | 534 | ||||||
| 2007 | 1,160 | 414 | 1,655 | 434 | 831 | 415 | 588 | 414 | 594 | 1,062 | 832 | |
| 2008 | 1,649 | 940 | 415 | 1,127 | 1,474 | 689 | 829 | 255 | 828 | 819 | 1,512 | |
| 2009 | 1,347 | 1,788 | 1,865 | 1,338 | 584 | 980 | 764 | 935 | 1,203 | 1,551 | ||
| 2010 | 813 | 1,656 | 789 | 415 | 805 | 388 | 416 | 414 | 1,510 | |||
| 2011 | 1,083 | 829 | 555 | 664 | 165 | 214 | 662 | 784 | ||||
| 2012 | 63 | 412 | 373 | 548 | ||||||||
| 2014 | 13 | |||||||||||
| 2016 | 577 | |||||||||||
| 2018 | 140 | |||||||||||
| 2022 | 506 | |||||||||||
| - = No Data Reported; -- = Not Applicable; NA = Not Available; W = Withheld to avoid disclosure of individual company data. |
| Release Date: 3/29/2024 |
| Next Release Date: 4/30/2024 |