|
Download Data (XLS File) |
|
||||||||
|
||||||||
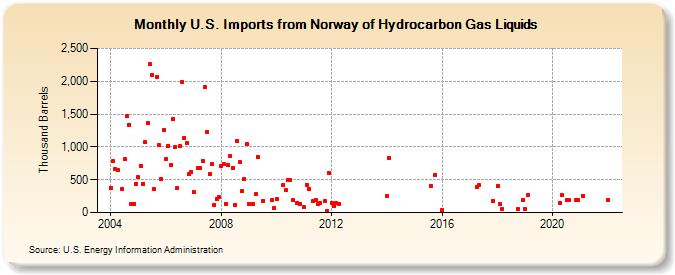
| U.S. Imports from Norway of Hydrocarbon Gas Liquids (Thousand Barrels) | ||||||||
| Year | Jan | Feb | Mar | Apr | May | Jun | Jul | Aug | Sep | Oct | Nov | Dec |
|---|---|---|---|---|---|---|---|---|---|---|---|---|
| 2004 | 381 | 786 | 662 | 655 | 355 | 811 | 1,466 | 1,337 | 124 | 133 | 439 | |
| 2005 | 535 | 714 | 438 | 1,070 | 1,366 | 2,255 | 2,099 | 362 | 2,068 | 1,027 | 509 | 1,263 |
| 2006 | 809 | 1,014 | 720 | 1,424 | 998 | 367 | 1,009 | 1,992 | 1,139 | 1,059 | 593 | 621 |
| 2007 | 319 | 676 | 672 | 790 | 1,908 | 1,225 | 589 | 740 | 116 | 209 | 236 | |
| 2008 | 704 | 739 | 133 | 727 | 858 | 677 | 117 | 1,094 | 767 | 321 | 517 | 1,041 |
| 2009 | 132 | 129 | 282 | 846 | 183 | 184 | 72 | |||||
| 2010 | 209 | 422 | 339 | 499 | 502 | 187 | 146 | 136 | ||||
| 2011 | 79 | 427 | 355 | 175 | 190 | 126 | 139 | 173 | 19 | 601 | ||
| 2012 | 139 | 101 | 145 | 131 | ||||||||
| 2014 | 247 | 832 | ||||||||||
| 2015 | 411 | 573 | ||||||||||
| 2016 | 43 | |||||||||||
| 2017 | 396 | 419 | 177 | |||||||||
| 2018 | 411 | 129 | 55 | 56 | 192 | |||||||
| 2019 | 47 | 262 | ||||||||||
| 2020 | 151 | 265 | 192 | 186 | 198 | 191 | ||||||
| 2021 | 253 | |||||||||||
| 2022 | 196 | |||||||||||
| - = No Data Reported; -- = Not Applicable; NA = Not Available; W = Withheld to avoid disclosure of individual company data. |
| Release Date: 6/28/2024 |
| Next Release Date: 7/31/2024 |