|
Download Data (XLS File) |
|
||||||||
|
||||||||
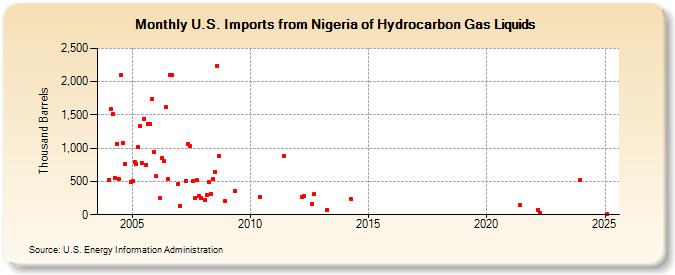
| U.S. Imports from Nigeria of Hydrocarbon Gas Liquids (Thousand Barrels) | ||||||||
| Year | Jan | Feb | Mar | Apr | May | Jun | Jul | Aug | Sep | Oct | Nov | Dec |
|---|---|---|---|---|---|---|---|---|---|---|---|---|
| 2004 | 528 | 1,591 | 1,518 | 551 | 1,064 | 534 | 2,095 | 1,071 | 763 | 496 | ||
| 2005 | 505 | 790 | 760 | 1,015 | 1,327 | 773 | 1,442 | 748 | 1,366 | 1,361 | 1,741 | 938 |
| 2006 | 576 | 247 | 850 | 808 | 1,615 | 534 | 2,105 | 2,100 | 459 | |||
| 2007 | 136 | 513 | 1,064 | 1,029 | 503 | 244 | 517 | 280 | 253 | |||
| 2008 | 225 | 295 | 487 | 310 | 533 | 646 | 2,236 | 876 | 213 | |||
| 2009 | 362 | |||||||||||
| 2010 | 267 | |||||||||||
| 2011 | 881 | |||||||||||
| 2012 | 271 | 277 | 163 | 306 | ||||||||
| 2013 | 73 | |||||||||||
| 2014 | 233 | |||||||||||
| 2021 | 144 | |||||||||||
| 2022 | 78 | 32 | ||||||||||
| 2023 | 526 | |||||||||||
| - = No Data Reported; -- = Not Applicable; NA = Not Available; W = Withheld to avoid disclosure of individual company data. |
| Release Date: 6/28/2024 |
| Next Release Date: 7/31/2024 |