|
Download Data (XLS File) |
|
||||||||
|
||||||||
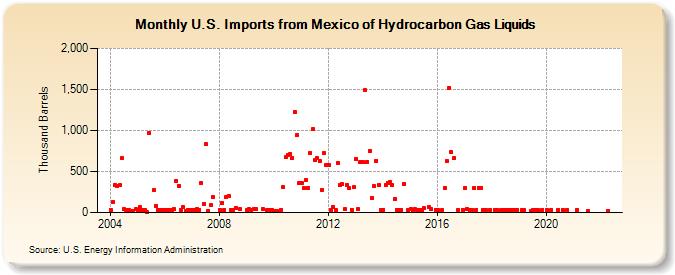
| U.S. Imports from Mexico of Hydrocarbon Gas Liquids (Thousand Barrels) | ||||||||
| Year | Jan | Feb | Mar | Apr | May | Jun | Jul | Aug | Sep | Oct | Nov | Dec |
|---|---|---|---|---|---|---|---|---|---|---|---|---|
| 2004 | 32 | 126 | 340 | 325 | 330 | 661 | 38 | 37 | 32 | 22 | 25 | 43 |
| 2005 | 36 | 68 | 32 | 37 | 1 | 972 | 274 | 77 | 37 | 37 | 36 | |
| 2006 | 37 | 37 | 34 | 37 | 43 | 390 | 329 | 33 | 65 | 23 | 37 | 36 |
| 2007 | 27 | 36 | 38 | 37 | 360 | 103 | 835 | 25 | 89 | 189 | ||
| 2008 | 36 | 117 | 31 | 192 | 199 | 33 | 37 | 60 | 38 | |||
| 2009 | 31 | 38 | 31 | 43 | 38 | 42 | 36 | 27 | 37 | |||
| 2010 | 18 | 18 | 35 | 309 | 673 | 701 | 714 | 664 | 1,226 | 943 | 356 | |
| 2011 | 360 | 302 | 393 | 303 | 728 | 1,017 | 636 | 659 | 623 | 279 | 725 | 579 |
| 2012 | 580 | 35 | 70 | 36 | 606 | 336 | 344 | 39 | 339 | 300 | 37 | 307 |
| 2013 | 653 | 38 | 612 | 610 | 1,487 | 616 | 747 | 176 | 323 | 634 | 335 | 34 |
| 2014 | 35 | 334 | 362 | 370 | 334 | 170 | 35 | 34 | 34 | 353 | 34 | |
| 2015 | 44 | 36 | 40 | 37 | 35 | 34 | 52 | 70 | 42 | 35 | ||
| 2016 | 36 | 32 | 300 | 630 | 1,522 | 733 | 660 | 32 | 36 | |||
| 2017 | 300 | 38 | 31 | 36 | 300 | 33 | 304 | 301 | 31 | 32 | 33 | |
| 2018 | 34 | 35 | 34 | 35 | 34 | 35 | 35 | 35 | 34 | 34 | ||
| 2019 | 33 | 34 | 20 | 36 | 36 | 34 | 32 | |||||
| 2020 | 33 | 33 | 32 | 33 | 29 | |||||||
| 2021 | 32 | 22 | ||||||||||
| 2022 | 25 | |||||||||||
| - = No Data Reported; -- = Not Applicable; NA = Not Available; W = Withheld to avoid disclosure of individual company data. |
| Release Date: 6/28/2024 |
| Next Release Date: 7/31/2024 |