|
Download Data (XLS File) |
|
||||||||
|
||||||||
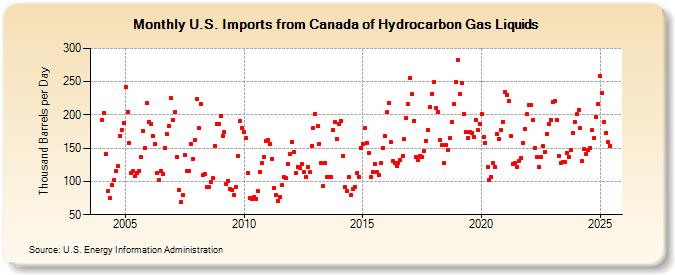
| U.S. Imports from Canada of Hydrocarbon Gas Liquids (Thousand Barrels per Day) | ||||||||
| Year | Jan | Feb | Mar | Apr | May | Jun | Jul | Aug | Sep | Oct | Nov | Dec |
|---|---|---|---|---|---|---|---|---|---|---|---|---|
| 2004 | 193 | 203 | 142 | 85 | 75 | 95 | 102 | 116 | 123 | 168 | 178 | 188 |
| 2005 | 242 | 205 | 158 | 112 | 116 | 108 | 112 | 116 | 137 | 176 | 150 | 218 |
| 2006 | 190 | 187 | 168 | 157 | 113 | 102 | 116 | 111 | 151 | 172 | 183 | 225 |
| 2007 | 193 | 205 | 136 | 87 | 69 | 80 | 140 | 116 | 116 | 157 | 133 | 163 |
| 2008 | 224 | 180 | 216 | 109 | 111 | 91 | 91 | 99 | 105 | 154 | 187 | 187 |
| 2009 | 199 | 168 | 174 | 96 | 101 | 89 | 87 | 80 | 92 | 138 | 191 | 180 |
| 2010 | 175 | 165 | 113 | 75 | 74 | 77 | 74 | 85 | 114 | 127 | 137 | 161 |
| 2011 | 163 | 157 | 134 | 90 | 80 | 71 | 76 | 94 | 106 | 105 | 126 | 141 |
| 2012 | 160 | 145 | 113 | 122 | 120 | 126 | 114 | 107 | 122 | 114 | 154 | 180 |
| 2013 | 202 | 183 | 157 | 128 | 93 | 128 | 106 | 107 | 106 | 178 | 189 | 164 |
| 2014 | 186 | 191 | 139 | 91 | 85 | 106 | 79 | 88 | 92 | 113 | 107 | 151 |
| 2015 | 156 | 180 | 158 | 143 | 106 | 114 | 126 | 114 | 109 | 127 | 151 | 168 |
| 2016 | 204 | 218 | 160 | 130 | 127 | 123 | 128 | 132 | 139 | 164 | 196 | 216 |
| 2017 | 256 | 231 | 191 | 136 | 132 | 139 | 136 | 146 | 161 | 178 | 212 | 232 |
| 2018 | 249 | 210 | 205 | 162 | 155 | 128 | 155 | 148 | 165 | 190 | 217 | 250 |
| 2019 | 282 | 232 | 248 | 201 | 175 | 165 | 174 | 173 | 167 | 193 | 178 | 187 |
| 2020 | 202 | 167 | 158 | 122 | 102 | 107 | 127 | 121 | 171 | 164 | 177 | 190 |
| 2021 | 234 | 230 | 221 | 168 | 126 | 128 | 122 | 131 | 135 | 158 | 179 | 201 |
| 2022 | 215 | 215 | 192 | 150 | 136 | 121 | 137 | 153 | 145 | 171 | 186 | 193 |
| 2023 | 216 | 219 | 193 | 133 | 127 | 128 | 129 | 143 | 136 | 149 | 173 | 189 |
| 2024 | 192 | 203 | 173 | 125 | ||||||||
| - = No Data Reported; -- = Not Applicable; NA = Not Available; W = Withheld to avoid disclosure of individual company data. |
| Release Date: 6/28/2024 |
| Next Release Date: 7/31/2024 |