|
Download Data (XLS File) |
|
||||||||
|
||||||||
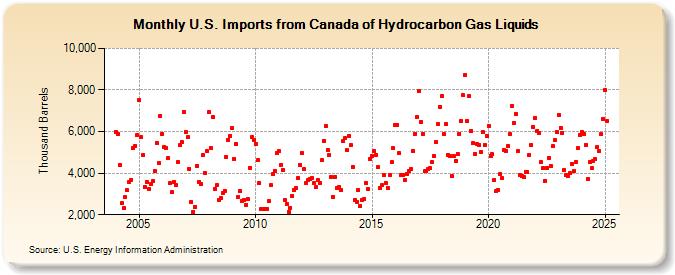
| U.S. Imports from Canada of Hydrocarbon Gas Liquids (Thousand Barrels) | ||||||||
| Year | Jan | Feb | Mar | Apr | May | Jun | Jul | Aug | Sep | Oct | Nov | Dec |
|---|---|---|---|---|---|---|---|---|---|---|---|---|
| 2004 | 5,974 | 5,897 | 4,392 | 2,541 | 2,320 | 2,837 | 3,173 | 3,584 | 3,688 | 5,212 | 5,326 | 5,813 |
| 2005 | 7,516 | 5,729 | 4,888 | 3,347 | 3,595 | 3,229 | 3,480 | 3,598 | 4,114 | 5,463 | 4,485 | 6,751 |
| 2006 | 5,884 | 5,245 | 5,219 | 4,709 | 3,505 | 3,074 | 3,594 | 3,445 | 4,517 | 5,333 | 5,495 | 6,963 |
| 2007 | 5,973 | 5,732 | 4,212 | 2,603 | 2,143 | 2,387 | 4,349 | 3,592 | 3,474 | 4,878 | 3,999 | 5,061 |
| 2008 | 6,932 | 5,206 | 6,697 | 3,258 | 3,428 | 2,718 | 2,822 | 3,062 | 3,160 | 4,782 | 5,596 | 5,800 |
| 2009 | 6,160 | 4,692 | 5,403 | 2,876 | 3,136 | 2,679 | 2,705 | 2,489 | 2,762 | 4,267 | 5,718 | 5,590 |
| 2010 | 5,419 | 4,619 | 3,516 | 2,261 | 2,292 | 2,298 | 2,284 | 2,641 | 3,406 | 3,938 | 4,109 | 4,992 |
| 2011 | 5,041 | 4,396 | 4,148 | 2,704 | 2,494 | 2,141 | 2,344 | 2,913 | 3,179 | 3,264 | 3,767 | 4,385 |
| 2012 | 4,958 | 4,192 | 3,510 | 3,651 | 3,718 | 3,775 | 3,542 | 3,314 | 3,647 | 3,546 | 4,612 | 5,566 |
| 2013 | 6,264 | 5,113 | 4,867 | 3,837 | 2,868 | 3,825 | 3,279 | 3,309 | 3,169 | 5,533 | 5,666 | 5,099 |
| 2014 | 5,770 | 5,335 | 4,298 | 2,724 | 2,629 | 3,183 | 2,442 | 2,716 | 2,764 | 3,516 | 3,218 | 4,674 |
| 2015 | 4,840 | 5,043 | 4,889 | 4,283 | 3,280 | 3,414 | 3,894 | 3,544 | 3,284 | 3,933 | 4,534 | 5,198 |
| 2016 | 6,322 | 6,332 | 4,965 | 3,902 | 3,926 | 3,677 | 3,954 | 4,097 | 4,177 | 5,081 | 5,886 | 6,692 |
| 2017 | 7,946 | 6,472 | 5,906 | 4,079 | 4,095 | 4,179 | 4,228 | 4,528 | 4,824 | 5,519 | 6,351 | 7,199 |
| 2018 | 7,707 | 5,888 | 6,362 | 4,867 | 4,807 | 3,853 | 4,815 | 4,603 | 4,940 | 5,893 | 6,505 | 7,737 |
| 2019 | 8,729 | 6,496 | 7,701 | 6,041 | 5,430 | 4,941 | 5,399 | 5,372 | 5,024 | 5,973 | 5,335 | 5,792 |
| 2020 | 6,267 | 4,847 | 4,902 | 3,672 | 3,160 | 3,200 | 3,952 | 3,763 | 5,132 | 5,086 | 5,305 | 5,883 |
| 2021 | 7,242 | 6,428 | 6,859 | 5,045 | 3,898 | 3,854 | 3,796 | 4,058 | 4,044 | 4,888 | 5,362 | 6,234 |
| 2022 | 6,656 | 6,033 | 5,946 | 4,513 | 4,229 | 3,641 | 4,262 | 4,733 | 4,340 | 5,288 | 5,576 | 5,982 |
| 2023 | 6,697 | 6,131 | 5,983 | 4,004 | 3,939 | 3,844 | 3,990 | 4,444 | 4,085 | 4,625 | 5,190 | 5,858 |
| 2024 | 5,957 | 5,876 | 5,367 | 3,739 | ||||||||
| - = No Data Reported; -- = Not Applicable; NA = Not Available; W = Withheld to avoid disclosure of individual company data. |
| Release Date: 6/28/2024 |
| Next Release Date: 7/31/2024 |