|
Download Data (XLS File) |
|
||||||||
|
||||||||
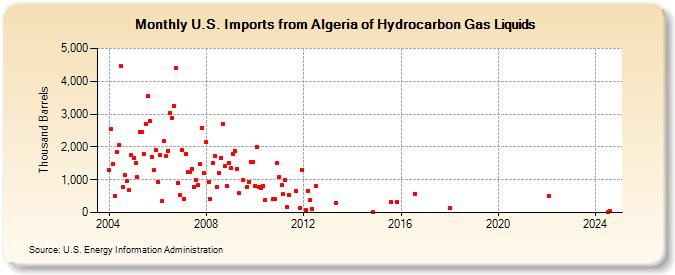
| U.S. Imports from Algeria of Hydrocarbon Gas Liquids (Thousand Barrels) | ||||||||
| Year | Jan | Feb | Mar | Apr | May | Jun | Jul | Aug | Sep | Oct | Nov | Dec |
|---|---|---|---|---|---|---|---|---|---|---|---|---|
| 2004 | 1,295 | 2,557 | 1,476 | 501 | 1,834 | 2,071 | 4,452 | 777 | 1,139 | 959 | 684 | 1,768 |
| 2005 | 1,670 | 1,510 | 1,087 | 2,458 | 2,451 | 1,786 | 2,706 | 3,539 | 2,778 | 1,703 | 1,294 | 1,896 |
| 2006 | 929 | 1,741 | 352 | 2,177 | 1,722 | 1,884 | 3,034 | 2,892 | 3,258 | 4,392 | 910 | 528 |
| 2007 | 1,914 | 414 | 1,797 | 1,225 | 1,246 | 1,325 | 792 | 1,002 | 828 | 1,468 | 2,588 | 1,208 |
| 2008 | 2,155 | 940 | 415 | 1,511 | 1,714 | 782 | 1,212 | 1,655 | 2,712 | 1,412 | 819 | 1,512 |
| 2009 | 1,347 | 1,788 | 1,865 | 1,338 | 584 | 980 | 764 | 935 | 1,536 | 1,551 | ||
| 2010 | 813 | 1,986 | 789 | 734 | 805 | 388 | 416 | 414 | 1,510 | |||
| 2011 | 1,083 | 836 | 555 | 982 | 165 | 534 | 662 | 150 | 1,301 | |||
| 2012 | 63 | 667 | 373 | 121 | 824 | |||||||
| 2013 | 302 | |||||||||||
| 2014 | 13 | |||||||||||
| 2015 | 320 | 320 | ||||||||||
| 2016 | 577 | |||||||||||
| 2018 | 140 | |||||||||||
| 2022 | 506 | |||||||||||
| - = No Data Reported; -- = Not Applicable; NA = Not Available; W = Withheld to avoid disclosure of individual company data. |
| Release Date: 6/28/2024 |
| Next Release Date: 7/31/2024 |