|
Download Data (XLS File) |
|
||||||||
|
||||||||
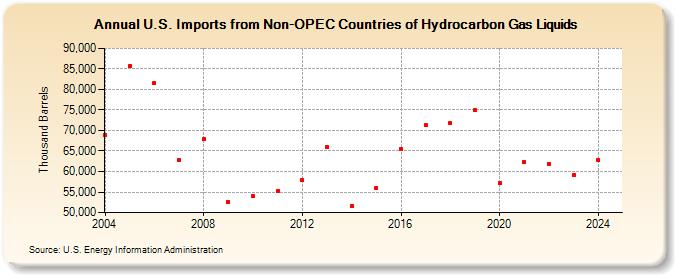
| U.S. Imports from Non-OPEC Countries of Hydrocarbon Gas Liquids (Thousand Barrels) | ||||||||
| Decade | Year-0 | Year-1 | Year-2 | Year-3 | Year-4 | Year-5 | Year-6 | Year-7 | Year-8 | Year-9 |
|---|---|---|---|---|---|---|---|---|---|---|
| 2000's | 68,918 | 85,632 | 81,560 | 62,793 | 67,847 | 52,539 | ||||
| 2010's | 54,026 | 55,216 | 57,879 | 65,915 | 51,600 | 56,000 | 65,448 | 71,228 | 71,813 | 74,941 |
| 2020's | 57,220 | 62,268 | 61,920 | 58,958 |
| - = No Data Reported; -- = Not Applicable; NA = Not Available; W = Withheld to avoid disclosure of individual company data. |
| Release Date: 3/29/2024 |
| Next Release Date: 8/30/2024 |