|
Download Data (XLS File) |
|
||||||||
|
||||||||
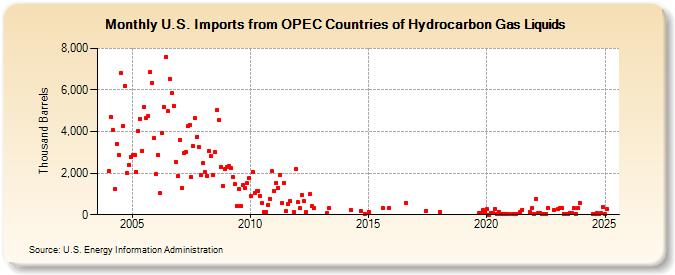
| U.S. Imports from OPEC Countries of Hydrocarbon Gas Liquids (Thousand Barrels) | ||||||||
| Year | Jan | Feb | Mar | Apr | May | Jun | Jul | Aug | Sep | Oct | Nov | Dec |
|---|---|---|---|---|---|---|---|---|---|---|---|---|
| 2004 | 2,082 | 4,689 | 4,086 | 1,221 | 3,418 | 2,853 | 6,805 | 4,245 | 6,212 | 1,993 | 2,389 | 2,799 |
| 2005 | 2,859 | 2,849 | 2,075 | 4,020 | 4,616 | 3,087 | 5,176 | 4,661 | 4,757 | 6,888 | 6,357 | 3,696 |
| 2006 | 1,959 | 2,891 | 1,044 | 3,940 | 5,171 | 7,599 | 4,998 | 6,551 | 5,857 | 5,252 | 2,554 | 1,851 |
| 2007 | 3,604 | 1,306 | 2,957 | 3,012 | 4,251 | 4,316 | 1,804 | 3,288 | 4,639 | 3,747 | 3,250 | 1,896 |
| 2008 | 2,480 | 2,034 | 1,877 | 3,074 | 2,826 | 1,904 | 3,023 | 5,059 | 4,554 | 2,288 | 1,386 | 2,190 |
| 2009 | 2,281 | 2,366 | 2,235 | 1,810 | 1,469 | 419 | 1,219 | 426 | 1,448 | 1,293 | 1,536 | 1,753 |
| 2010 | 881 | 2,053 | 1,038 | 1,122 | 1,163 | 906 | 558 | 107 | 142 | 470 | 763 | 2,085 |
| 2011 | 1,151 | 1,502 | 1,300 | 1,905 | 551 | 1,537 | 164 | 499 | 662 | 150 | 2,214 | |
| 2012 | 590 | 311 | 938 | 650 | 121 | 974 | 423 | 306 | ||||
| 2013 | 73 | 302 | ||||||||||
| 2014 | 233 | 185 | 13 | |||||||||
| 2015 | 149 | 320 | 320 | |||||||||
| 2016 | 577 | |||||||||||
| 2017 | 199 | |||||||||||
| 2018 | 140 | |||||||||||
| 2019 | 74 | 90 | 224 | 109 | ||||||||
| 2020 | 259 | 10 | 100 | 80 | 293 | 47 | 149 | 56 | 26 | 29 | 56 | 55 |
| 2021 | 54 | 57 | 54 | 144 | 245 | 110 | 311 | |||||
| 2022 | 43 | 746 | 78 | 97 | 45 | 49 | 53 | 334 | 237 | |||
| 2023 | 257 | 300 | 318 | 49 | 53 | 57 | 103 | 65 | 316 | 55 | 312 | 581 |
| - = No Data Reported; -- = Not Applicable; NA = Not Available; W = Withheld to avoid disclosure of individual company data. |
| Release Date: 3/29/2024 |
| Next Release Date: 4/30/2024 |