|
Download Data (XLS File) |
|
||||||||
|
||||||||
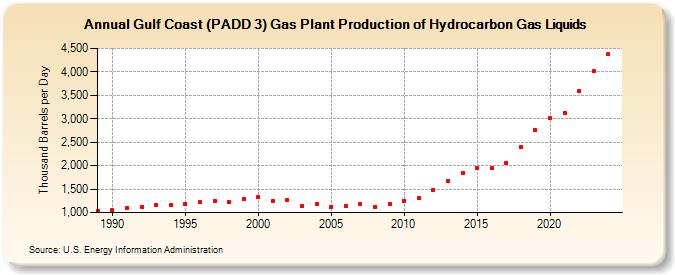
| Gulf Coast (PADD 3) Gas Plant Production of Hydrocarbon Gas Liquids (Thousand Barrels per Day) | ||||||||
| Decade | Year-0 | Year-1 | Year-2 | Year-3 | Year-4 | Year-5 | Year-6 | Year-7 | Year-8 | Year-9 |
|---|---|---|---|---|---|---|---|---|---|---|
| 1980's | 1,036 | |||||||||
| 1990's | 1,046 | 1,096 | 1,126 | 1,162 | 1,158 | 1,188 | 1,226 | 1,241 | 1,219 | 1,286 |
| 2000's | 1,323 | 1,245 | 1,260 | 1,131 | 1,192 | 1,123 | 1,149 | 1,178 | 1,126 | 1,179 |
| 2010's | 1,253 | 1,314 | 1,476 | 1,663 | 1,834 | 1,956 | 1,942 | 2,058 | 2,400 | 2,752 |
| 2020's | 3,006 | 3,133 | 3,596 | 3,950 |
| - = No Data Reported; -- = Not Applicable; NA = Not Available; W = Withheld to avoid disclosure of individual company data. |
| Release Date: 3/29/2024 |
| Next Release Date: 8/30/2024 |