|
Download Data (XLS File) |
|
||||||||
|
||||||||
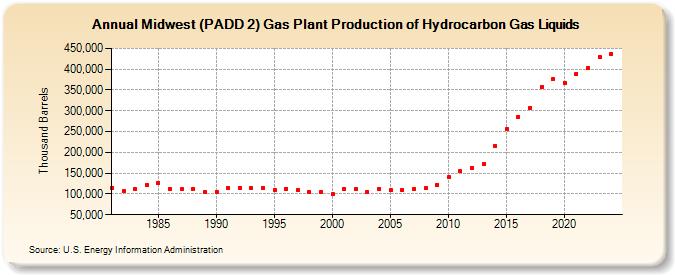
| Midwest (PADD 2) Gas Plant Production of Hydrocarbon Gas Liquids (Thousand Barrels) | ||||||||
| Decade | Year-0 | Year-1 | Year-2 | Year-3 | Year-4 | Year-5 | Year-6 | Year-7 | Year-8 | Year-9 |
|---|---|---|---|---|---|---|---|---|---|---|
| 1980's | 114,113 | 106,251 | 110,697 | 122,590 | 126,909 | 112,118 | 111,061 | 111,296 | 103,877 | |
| 1990's | 105,545 | 114,418 | 115,447 | 114,094 | 114,368 | 110,264 | 112,759 | 109,286 | 104,652 | 105,023 |
| 2000's | 98,781 | 112,575 | 111,843 | 105,125 | 112,784 | 108,834 | 109,950 | 111,346 | 113,890 | 122,334 |
| 2010's | 140,233 | 154,020 | 163,238 | 171,974 | 216,201 | 256,479 | 285,045 | 306,896 | 357,756 | 375,780 |
| 2020's | 367,429 | 389,098 | 402,760 | 430,665 |
| - = No Data Reported; -- = Not Applicable; NA = Not Available; W = Withheld to avoid disclosure of individual company data. |
| Release Date: 3/29/2024 |
| Next Release Date: 8/30/2024 |