|
Download Data (XLS File) |
|
||||||||
|
||||||||
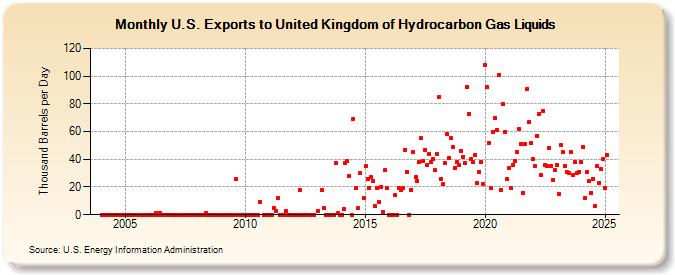
| U.S. Exports to United Kingdom of Hydrocarbon Gas Liquids (Thousand Barrels per Day) | ||||||||
| Year | Jan | Feb | Mar | Apr | May | Jun | Jul | Aug | Sep | Oct | Nov | Dec |
|---|---|---|---|---|---|---|---|---|---|---|---|---|
| 2004 | 0 | 0 | 0 | 0 | 0 | 0 | 0 | 0 | 0 | 0 | 0 | 0 |
| 2005 | 0 | 0 | 0 | 0 | 0 | 0 | 0 | 0 | 0 | 0 | ||
| 2006 | 0 | 0 | 0 | 1 | 0 | 1 | 0 | 0 | 0 | 0 | 0 | 0 |
| 2007 | 0 | 0 | 0 | 0 | 0 | 0 | 0 | 0 | 0 | 0 | 0 | |
| 2008 | 0 | 0 | 0 | 0 | 1 | 0 | 0 | 0 | 0 | 0 | 0 | 0 |
| 2009 | 0 | 0 | 0 | 0 | 0 | 0 | 26 | 0 | 0 | 0 | ||
| 2010 | 0 | 0 | 0 | 0 | 0 | 0 | 0 | 9 | 0 | 0 | 0 | |
| 2011 | 0 | 0 | 5 | 3 | 12 | 0 | 0 | 0 | 3 | 0 | 0 | 0 |
| 2012 | 0 | 0 | 0 | 18 | 0 | 0 | 0 | 0 | 0 | 0 | ||
| 2013 | 3 | 18 | 5 | 0 | 0 | 0 | 0 | 0 | 37 | 1 | 0 | |
| 2014 | 0 | 4 | 37 | 39 | 28 | 0 | 69 | 19 | 5 | 30 | 12 | |
| 2015 | 35 | 26 | 19 | 27 | 24 | 6 | 19 | 9 | 20 | 2 | 32 | 19 |
| 2016 | 0 | 0 | 0 | 14 | 0 | 19 | 18 | 19 | 47 | 31 | 0 | 18 |
| 2017 | 45 | 27 | 24 | 38 | 55 | 39 | 47 | 36 | 44 | 38 | 40 | 32 |
| 2018 | 44 | 85 | 26 | 22 | 37 | 58 | 41 | 55 | 49 | 34 | 38 | 36 |
| 2019 | 46 | 42 | 37 | 92 | 73 | 40 | 38 | 43 | 23 | 31 | 38 | 22 |
| 2020 | 108 | 92 | 52 | 19 | 60 | 70 | 61 | 101 | 18 | 80 | 60 | 26 |
| 2021 | 34 | 19 | 36 | 39 | 45 | 62 | 51 | 16 | 51 | 91 | 67 | 52 |
| 2022 | 40 | 35 | 57 | 73 | 29 | 75 | 36 | 35 | 48 | 35 | 25 | 32 |
| 2023 | 36 | 15 | 59 | 47 | 35 | 31 | 30 | 45 | 34 | 38 | 30 | 31 |
| 2024 | 38 | 49 | 12 | 31 | ||||||||
| - = No Data Reported; -- = Not Applicable; NA = Not Available; W = Withheld to avoid disclosure of individual company data. |
| Release Date: 6/28/2024 |
| Next Release Date: 7/31/2024 |