|
Download Data (XLS File) |
|
||||||||
|
||||||||
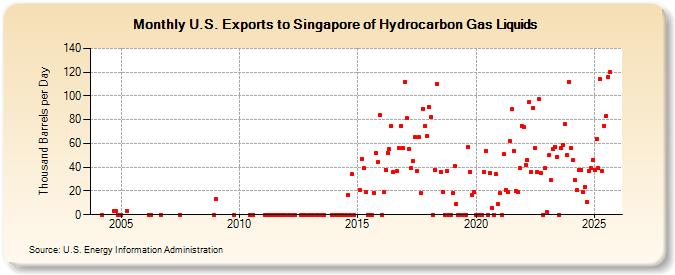
| U.S. Exports to Singapore of Hydrocarbon Gas Liquids (Thousand Barrels per Day) | ||||||||
| Year | Jan | Feb | Mar | Apr | May | Jun | Jul | Aug | Sep | Oct | Nov | Dec |
|---|---|---|---|---|---|---|---|---|---|---|---|---|
| 2004 | 0 | 3 | 3 | 0 | ||||||||
| 2005 | 0 | 3 | ||||||||||
| 2006 | 0 | 0 | 0 | |||||||||
| 2007 | 0 | |||||||||||
| 2008 | 0 | |||||||||||
| 2009 | 13 | 0 | ||||||||||
| 2010 | 0 | 0 | ||||||||||
| 2011 | 0 | 0 | 0 | 0 | 0 | 0 | 0 | 0 | 0 | 0 | 0 | |
| 2012 | 0 | 0 | 0 | 0 | 0 | 0 | 0 | |||||
| 2013 | 0 | 0 | 0 | 0 | 0 | 0 | 0 | |||||
| 2014 | 0 | 0 | 0 | 0 | 0 | 17 | 0 | 34 | 0 | |||
| 2015 | 21 | 47 | 39 | 19 | 0 | 0 | 0 | 18 | 52 | 44 | 84 | |
| 2016 | 0 | 19 | 38 | 52 | 55 | 75 | 36 | 37 | 56 | 75 | 56 | |
| 2017 | 112 | 81 | 55 | 39 | 45 | 65 | 37 | 65 | 18 | 89 | 75 | 66 |
| 2018 | 91 | 82 | 0 | 38 | 110 | 36 | 19 | 0 | 37 | 0 | 0 | |
| 2019 | 18 | 41 | 9 | 0 | 0 | 0 | 0 | 57 | 36 | 17 | 19 | |
| 2020 | 0 | 0 | 0 | 0 | 36 | 54 | 0 | 35 | 6 | 0 | 34 | 9 |
| 2021 | 18 | 0 | 51 | 21 | 19 | 62 | 89 | 54 | 20 | 19 | 39 | 75 |
| 2022 | 74 | 42 | 46 | 95 | 36 | 90 | 56 | 36 | 97 | 35 | 0 | 39 |
| 2023 | 1 | 44 | 0 | 48 | 57 | 38 | 0 | 57 | 69 | 69 | 73 | 112 |
| 2024 | 74 | |||||||||||
| - = No Data Reported; -- = Not Applicable; NA = Not Available; W = Withheld to avoid disclosure of individual company data. |
| Release Date: 3/29/2024 |
| Next Release Date: 4/30/2024 |