|
Download Data (XLS File) |
|
||||||||
|
||||||||
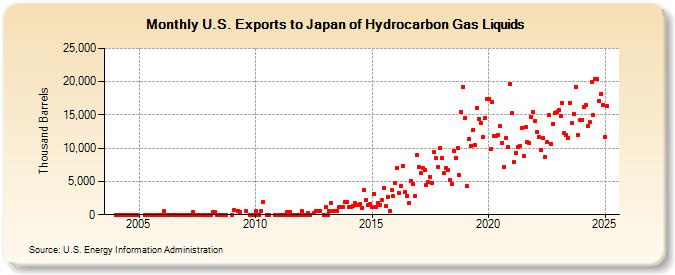
| U.S. Exports to Japan of Hydrocarbon Gas Liquids (Thousand Barrels) | ||||||||
| Year | Jan | Feb | Mar | Apr | May | Jun | Jul | Aug | Sep | Oct | Nov | Dec |
|---|---|---|---|---|---|---|---|---|---|---|---|---|
| 2004 | 2 | 1 | 1 | 1 | 2 | 0 | 1 | 0 | 1 | 2 | 3 | |
| 2005 | 1 | 1 | 1 | 1 | 1 | 1 | 2 | |||||
| 2006 | 2 | 496 | 1 | 1 | 1 | 2 | 1 | 1 | 1 | 1 | 2 | |
| 2007 | 1 | 1 | 1 | 444 | 1 | 1 | 1 | 0 | 1 | |||
| 2008 | 0 | 0 | 459 | 439 | 3 | 2 | 3 | 0 | ||||
| 2009 | 2 | 716 | 550 | 403 | 545 | 1 | 0 | 1 | ||||
| 2010 | 512 | 0 | 1 | 550 | 1,911 | 0 | 1 | 1 | ||||
| 2011 | 4 | 6 | 1 | 3 | 434 | 0 | 476 | 1 | 2 | 2 | 1 | |
| 2012 | 550 | 1 | 1 | 264 | 1 | 261 | 550 | 550 | 550 | 3 | ||
| 2013 | 1,102 | 3 | 525 | 1,700 | 525 | 578 | 578 | 1,100 | 1,153 | 1,150 | 1,882 | 1,942 |
| 2014 | 1,129 | 1,105 | 1,383 | 1,706 | 1,507 | 1,516 | 1,601 | 990 | 3,760 | 2,274 | 1,517 | 1,669 |
| 2015 | 1,140 | 3,120 | 1,162 | 1,784 | 1,514 | 2,163 | 3,995 | 1,336 | 2,699 | 528 | 3,689 | 2,804 |
| 2016 | 4,755 | 6,949 | 3,249 | 4,265 | 7,384 | 3,355 | 2,837 | 1,700 | 5,078 | 4,594 | 2,789 | 8,908 |
| 2017 | 7,141 | 6,213 | 7,017 | 6,760 | 4,479 | 4,921 | 5,704 | 4,741 | 9,456 | 8,519 | 7,160 | 10,050 |
| 2018 | 8,537 | 6,227 | 7,010 | 6,698 | 5,146 | 4,601 | 9,607 | 8,536 | 10,053 | 5,979 | 15,458 | 19,221 |
| 2019 | 14,573 | 4,382 | 11,405 | 10,387 | 12,701 | 10,508 | 16,011 | 14,416 | 13,818 | 11,630 | 14,594 | 17,466 |
| 2020 | 17,461 | 9,859 | 16,870 | 11,878 | 11,856 | 11,949 | 13,296 | 10,720 | 7,124 | 11,552 | 10,170 | 19,645 |
| 2021 | 15,294 | 7,976 | 9,223 | 10,176 | 10,300 | 13,094 | 8,887 | 13,164 | 11,001 | 10,729 | 14,732 | 15,418 |
| 2022 | 14,122 | 12,396 | 11,722 | 9,718 | 11,485 | 8,686 | 10,919 | 14,957 | 10,607 | 13,583 | 15,315 | 15,394 |
| 2023 | 17,130 | 15,961 | 17,692 | 11,549 | 11,852 | 12,960 | 17,735 | 15,508 | 16,663 | 20,277 | 13,738 | 15,595 |
| 2024 | 14,253 | |||||||||||
| - = No Data Reported; -- = Not Applicable; NA = Not Available; W = Withheld to avoid disclosure of individual company data. |
| Release Date: 3/29/2024 |
| Next Release Date: 4/30/2024 |